%20--%3e%3csvg%20xmlns:dc='http://purl.org/dc/elements/1.1/'%20xmlns:cc='http://creativecommons.org/ns%23'%20xmlns:rdf='http://www.w3.org/1999/02/22-rdf-syntax-ns%23'%20xmlns:svg='http://www.w3.org/2000/svg'%20xmlns='http://www.w3.org/2000/svg'%20xmlns:sodipodi='http://sodipodi.sourceforge.net/DTD/sodipodi-0.dtd'%20xmlns:inkscape='http://www.inkscape.org/namespaces/inkscape'%20version='1.1'%20x='0px'%20y='0px'%20width='2019.428'%20height='436.51999'%20viewBox='0%200%202019.428%20436.51998'%20enable-background='new%200%200%202001.428%20416.519'%20xml:space='preserve'%20id='svg2'%20inkscape:version='0.48.4%20r9939'%20sodipodi:docname='serverpilot-logo-horizontal-black.svg'%20inkscape:export-filename='/home/justin/tmp/shirt/horizontal/serverpilot-logo-horizontal-black.png'%20inkscape:export-xdpi='26.802896'%20inkscape:export-ydpi='26.802896'%3e%3cmetadata%20id='metadata20'%3e%3crdf:RDF%3e%3ccc:Work%20rdf:about=''%3e%3cdc:format%3eimage/svg+xml%3c/dc:format%3e%3cdc:type%20rdf:resource='http://purl.org/dc/dcmitype/StillImage'%20/%3e%3cdc:title%3e%3c/dc:title%3e%3c/cc:Work%3e%3c/rdf:RDF%3e%3c/metadata%3e%3cdefs%20id='defs18'%20/%3e%3csodipodi:namedview%20pagecolor='%23ffffff'%20bordercolor='%23666666'%20borderopacity='1'%20objecttolerance='10'%20gridtolerance='10'%20guidetolerance='10'%20inkscape:pageopacity='0'%20inkscape:pageshadow='2'%20inkscape:window-width='1278'%20inkscape:window-height='657'%20id='namedview16'%20showgrid='false'%20fit-margin-top='10'%20fit-margin-right='10'%20fit-margin-bottom='10'%20fit-margin-left='10'%20inkscape:zoom='0.45014485'%20inkscape:cx='1010.714'%20inkscape:cy='218.2605'%20inkscape:window-x='0'%20inkscape:window-y='24'%20inkscape:window-maximized='0'%20inkscape:current-layer='svg2'%20/%3e%3cg%20id='Layer_2'%20transform='translate(10,9.9999916)'%20style='fill:%23000000'%3e%3cg%20id='g5'%20style='fill:%23000000'%3e%3cg%20id='g7'%20style='fill:%23000000'%3e%3cpath%20d='m%20664.138,198.242%20c%20-9.577,-4.71%20-19.199,-8.947%20-28.863,-12.694%20-9.652,-3.75%20-17.872,-8.084%20-24.638,-12.994%20-6.769,-4.906%20-10.15,-10.728%20-10.15,-17.461%200,-7.309%202.994,-13.326%209,-18.036%205.993,-4.722%2013.514,-7.077%2022.549,-7.077%207.872,0%2015.835,1.687%2023.895,5.053%208.075,3.373%2013.425,6.087%2016.056,8.15%202.633,2.072%204.735,3.781%206.262,5.125%20l%2016.543,-30.874%20-2.875,-2.572%20c%20-15.749,-13.115%20-35.608,-19.673%20-59.583,-19.673%20-19.926,0%20-36.546,5.785%20-49.851,17.34%20-13.301,11.566%20-19.949,25.943%20-19.949,43.138%200,11.836%203.361,22.083%2010.107,30.741%206.757,8.659%2014.887,15.371%2024.393,20.137%209.502,4.761%2019.134,9.111%2028.886,13.061%209.744,3.946%2018.025,8.514%2024.85,13.711%206.82,5.197%2010.227,11.159%2010.227,17.892%200,8.085%20-2.95,14.339%20-8.854,18.769%20-5.918,4.421%20-13.083,6.633%20-21.544,6.633%20-5.539,0%20-11.159,-0.797%20-16.832,-2.378%20-5.681,-1.587%20-10.403,-3.371%20-14.186,-5.34%20-3.771,-1.969%20-7.475,-4.236%20-11.102,-6.784%20-3.628,-2.552%20-6.039,-4.329%20-7.233,-5.336%20-1.196,-1.02%20-2.077,-1.808%20-2.654,-2.389%20l%20-20.557,28.64%204.601,4.425%20c%2018.854,15.967%2041.258,23.95%2067.246,23.95%2021.098,0%2037.884,-5.87%2050.357,-17.626%2012.476,-11.756%2018.71,-26.23%2018.71,-43.424%200,-12.415%20-3.404,-23.02%20-10.205,-31.826%20-6.815,-8.803%20-15.01,-15.56%20-24.606,-20.281%20z%20M%20788.295,154.13%20c%20-22.313,0%20-40.604,7.309%20-54.822,21.928%20-14.247,14.608%20-21.367,33.518%20-21.367,56.708%200,21.952%207.41,40.538%2022.217,55.777%2014.807,15.237%2034.279,22.856%2058.431,22.856%207.089,0%2014.011,-0.806%2020.778,-2.42%206.746,-1.621%2012.275,-3.385%2016.6,-5.299%204.301,-1.907%208.479,-4.111%2012.505,-6.611%204.028,-2.499%206.636,-4.265%207.83,-5.292%201.196,-1.026%202.081,-1.84%202.655,-2.427%20l%20-14.619,-26.673%20-5.33,3.954%20c%20-3.739,2.726%20-9.222,5.43%20-16.454,8.11%20-7.232,2.688%20-14.399,4.024%20-21.498,4.024%20-11.791,0%20-21.939,-3.403%20-30.474,-10.233%20-8.527,-6.818%20-13.361,-16.395%20-14.51,-28.725%20h%20103.757%20l%200.873,-14.375%20c%200,-20.6%20-5.848,-37.636%20-17.538,-51.1%20C%20825.63,160.865%20809.297,154.13%20788.295,154.13%20z%20m%20-37.087,60.09%20c%201.736,-9.775%205.762,-17.416%2012.087,-22.929%206.316,-5.512%2014.278,-8.266%2023.864,-8.266%208.438,0%2015.448,2.753%2021.055,8.266%205.607,5.513%208.505,13.154%208.703,22.929%20h%20-65.709%20z%20m%20179.928,-48.358%20c%20-8.523,6.869%20-14.574,15.615%20-18.135,26.253%20h%20-0.587%20l%200.609,-9.925%20v%20-24.465%20h%20-36.515%20v%20150.083%20h%2037.953%20v%20-60.555%20c%200,-9.755%201.093,-18.037%203.305,-24.865%203.364,-10.529%208.824,-18.495%2016.39,-23.915%207.562,-5.408%2015.769,-8.116%2024.581,-8.116%203.261,0%206.181,0.193%208.771,0.575%20v%20-34.824%20l%20-6.759,-0.541%20c%20-11.209,0.001%20-21.086,3.434%20-29.613,10.295%20z%20m%20123.133,84.873%20c%20-0.771,2.492%20-1.578,5.656%20-2.446,9.488%20l%20-2.155,9.344%20-0.717,3.736%20h%20-0.573%20l%20-0.576,-3.736%20-2.156,-9.344%20c%20-0.863,-3.738%20-1.682,-6.9%20-2.446,-9.488%20l%20-31.338,-93.01%20h%20-39.39%20l%2054.487,150.083%20h%2044.132%20L%201125,157.725%20h%20-39.534%20l%20-31.197,93.01%20z%20m%20154.464,-96.605%20c%20-22.328,0%20-40.607,7.309%20-54.838,21.928%20-14.233,14.608%20-21.354,33.518%20-21.354,56.708%200,21.952%207.408,40.538%2022.215,55.777%2014.809,15.237%2034.282,22.856%2058.432,22.856%207.09,0%2014.011,-0.806%2020.768,-2.42%206.758,-1.621%2012.287,-3.385%2016.601,-5.299%204.311,-1.907%208.492,-4.111%2012.515,-6.611%204.024,-2.499%206.637,-4.265%207.83,-5.292%201.193,-1.026%202.08,-1.84%202.656,-2.427%20l%20-14.619,-26.673%20-5.333,3.954%20c%20-3.736,2.726%20-9.221,5.43%20-16.454,8.11%20-7.229,2.688%20-14.396,4.024%20-21.498,4.024%20-11.787,0%20-21.94,-3.403%20-30.477,-10.233%20-8.523,-6.818%20-13.358,-16.395%20-14.508,-28.725%20h%20103.762%20l%200.873,-14.375%20c%200,-20.6%20-5.85,-37.636%20-17.539,-51.1%20-11.702,-13.467%20-28.043,-20.202%20-49.032,-20.202%20z%20m%20-37.091,60.09%20c%201.724,-9.775%205.749,-17.416%2012.077,-22.929%206.323,-5.512%2014.287,-8.266%2023.863,-8.266%208.438,0%2015.459,2.753%2021.062,8.266%205.611,5.513%208.506,13.154%208.705,22.929%20h%20-65.707%20z%20m%20174.034,-48.358%20c%20-8.524,6.869%20-14.575,15.615%20-18.135,26.253%20h%20-0.575%20l%200.597,-9.925%20v%20-24.465%20h%20-36.515%20V%20307.808%20H%201329%20v%20-60.555%20c%200,-9.755%201.105,-18.037%203.318,-24.865%203.34,-10.529%208.804,-18.495%2016.387,-23.915%207.564,-5.408%2015.758,-8.116%2024.573,-8.116%203.264,0%206.191,0.193%208.78,0.575%20v%20-34.824%20l%20-6.768,-0.541%20c%20-11.214,0.001%20-21.077,3.434%20-29.614,10.295%20z%20m%20144.243,-67.077%20h%20-80.335%20v%20209.022%20h%2037.949%20v%20-72.455%20h%2042.386%20c%2019.574,0%2035.509,-6.369%2047.817,-19.118%2012.315,-12.741%2018.478,-29.229%2018.478,-49.454%200,-20.219%20-6.162,-36.608%20-18.478,-49.165%20-12.308,-12.551%20-28.242,-18.83%20-47.817,-18.83%20z%20m%2019.044,94.237%20c%20-6.191,6.463%20-14.807,9.698%20-25.855,9.698%20h%20-35.574%20v%20-71.303%20h%2036.159%20c%2010.651,0%2019.079,3.184%2025.271,9.56%206.203,6.374%209.299,14.978%209.299,25.803%20-10e-4,11.026%20-3.096,19.768%20-9.3,26.242%20z%20m%20110.15,-94.237%20h%20-37.663%20v%2032.632%20h%2037.663%20V%2098.785%20z%20m%20-37.663,209.022%20h%2037.95%20V%20157.725%20h%20-37.95%20v%20150.082%20z%20m%20115.15,-35.663%20c%20-2.443,-2.98%20-3.673,-8.416%20-3.673,-16.3%20V%2098.785%20h%20-37.95%20v%20162.156%20c%200,10.162%201.403,18.69%204.199,25.591%202.787,6.9%206.724,11.887%2011.769,14.949%205.042,3.072%209.995,5.133%2014.862,6.182%204.844,1.054%2010.283,1.581%2016.322,1.581%204.025,0%207.915,-0.282%2011.654,-0.846%20v%20-32.075%20l%20-5.463,0.288%20c%20-5.375,0%20-9.28,-1.487%20-11.72,-4.467%20z%20m%20171.004,-95.477%20c%20-15.96,-15.023%20-35.542,-22.538%20-58.721,-22.538%20-23.201,0%20-42.729,7.514%20-58.587,22.538%20-15.857,15.028%20-23.797,33.721%20-23.797,56.098%200,22.381%207.939,41.08%2023.797,56.099%2015.857,15.027%2035.475,22.534%2058.874,22.534%2023.177,0%2042.708,-7.507%2058.577,-22.534%2015.854,-15.02%2023.784,-33.718%2023.784,-56.099%2010e-4,-22.376%20-7.971,-41.07%20-23.927,-56.098%20z%20m%20-26.96,89.24%20c%20-8.625,8.576%20-19.109,12.859%20-31.474,12.859%20-12.563,0%20-23.154,-4.283%20-31.779,-12.859%20-8.627,-8.572%20-12.941,-19.595%20-12.941,-33.07%200,-13.286%204.359,-24.284%2013.094,-33.002%208.715,-8.716%2019.266,-13.071%2031.627,-13.071%2012.364,0%2022.849,4.355%2031.474,13.071%208.626,8.718%2012.938,19.716%2012.938,33.002%200,13.475%20-4.313,24.497%20-12.939,33.07%20z%20m%20152.028,10.704%20c%20-7.387,0%20-14.155,-2.02%20-20.348,-6.061%20-6.172,-4.035%20-9.268,-11.489%20-9.268,-22.354%20v%20-58.414%20h%2033.642%20v%20-28.896%20h%20-33.642%20v%20-44.133%20h%20-36.945%20v%2044.133%20h%20-19.983%20v%2028.896%20h%2018.978%20v%2062.966%20c%200,9.585%201.549,17.969%204.655,25.155%203.107,7.188%206.878,12.701%2011.335,16.532%204.468,3.838%209.765,6.924%2015.901,9.272%206.149,2.352%2011.589,3.861%2016.346,4.528%204.732,0.676%209.643,1.007%2014.726,1.007%204.604,0%208.385,-0.286%2011.359,-0.856%20v%20-32.351%20l%20-6.756,0.576%20z'%20id='path9'%20inkscape:connector-curvature='0'%20style='fill:%23000000'%20/%3e%3c/g%3e%3c/g%3e%3c/g%3e%3cg%20id='Layer_1'%20transform='translate(10,9.9999916)'%20style='fill:%23000000'%3e%3cg%20id='g12'%20style='fill:%23000000'%3e%3cpath%20d='M%20208.26,0%20C%2093.24,0%200,93.239%200,208.259%20c%200,40.912%2011.974,78.964%2032.357,111.15%209.999,1.562%2020.988,3.937%2030.291,6.187%20C%2081.358,298.324%20129.691,241.6%20167.112,198.589%20134.481,184.865%2072.541,158.74%2038.649,144.018%20c%20-4.257,-1.837%208.672,-14.197%2013.41,-16.257%2024.346,-10.635%20114.62,10.844%20157.868,22.136%203.805,-4.278%205.984,-6.706%205.984,-6.706%208.402,-8.803%2065.506,-66.144%2087.635,-44.218%2022.162,21.939%20-28.439,85.728%20-36.857,94.539%200,0%20-1.771,1.693%20-4.939,4.711%2011.868,41.784%2037.388,138.376%2027.271,164.265%20-1.896,4.907%20-13.651,18.395%20-15.612,14.13%20-16.095,-35.715%20-45.315,-102.41%20-59.041,-133.73%20-41.692,38.918%20-97.391,89.814%20-124.257,109.647%202.54,9.696%205.302,21.276%207.125,31.708%2032.161,20.337%2070.16,32.277%20111.025,32.277%20115.02,0%20208.26,-93.239%20208.26,-208.26%20C%20416.521,93.239%20323.28,0%20208.26,0%20z'%20id='path14'%20inkscape:connector-curvature='0'%20style='fill:%23000000'%20/%3e%3c/g%3e%3c/g%3e%3c/svg%3e)
Advanced metrics for WordPress and PHP hosting
ServerPilot’s new monitoring dashboards include extensive metrics that give you a deep and practical understanding of your servers and the WordPress and PHP apps you’re hosting. With metrics ranging from MySQL cache status to per-app PHP memory usage, along with built-in explanations of all charts, you can quickly identify code problems, performance issues, and resource limitations that are impossible to see otherwise.
If you’re already using ServerPilot, view your monitoring dashboards.
If you’re not using ServerPilot, create an account to get started.
Monitoring Dashboards
Server Metrics
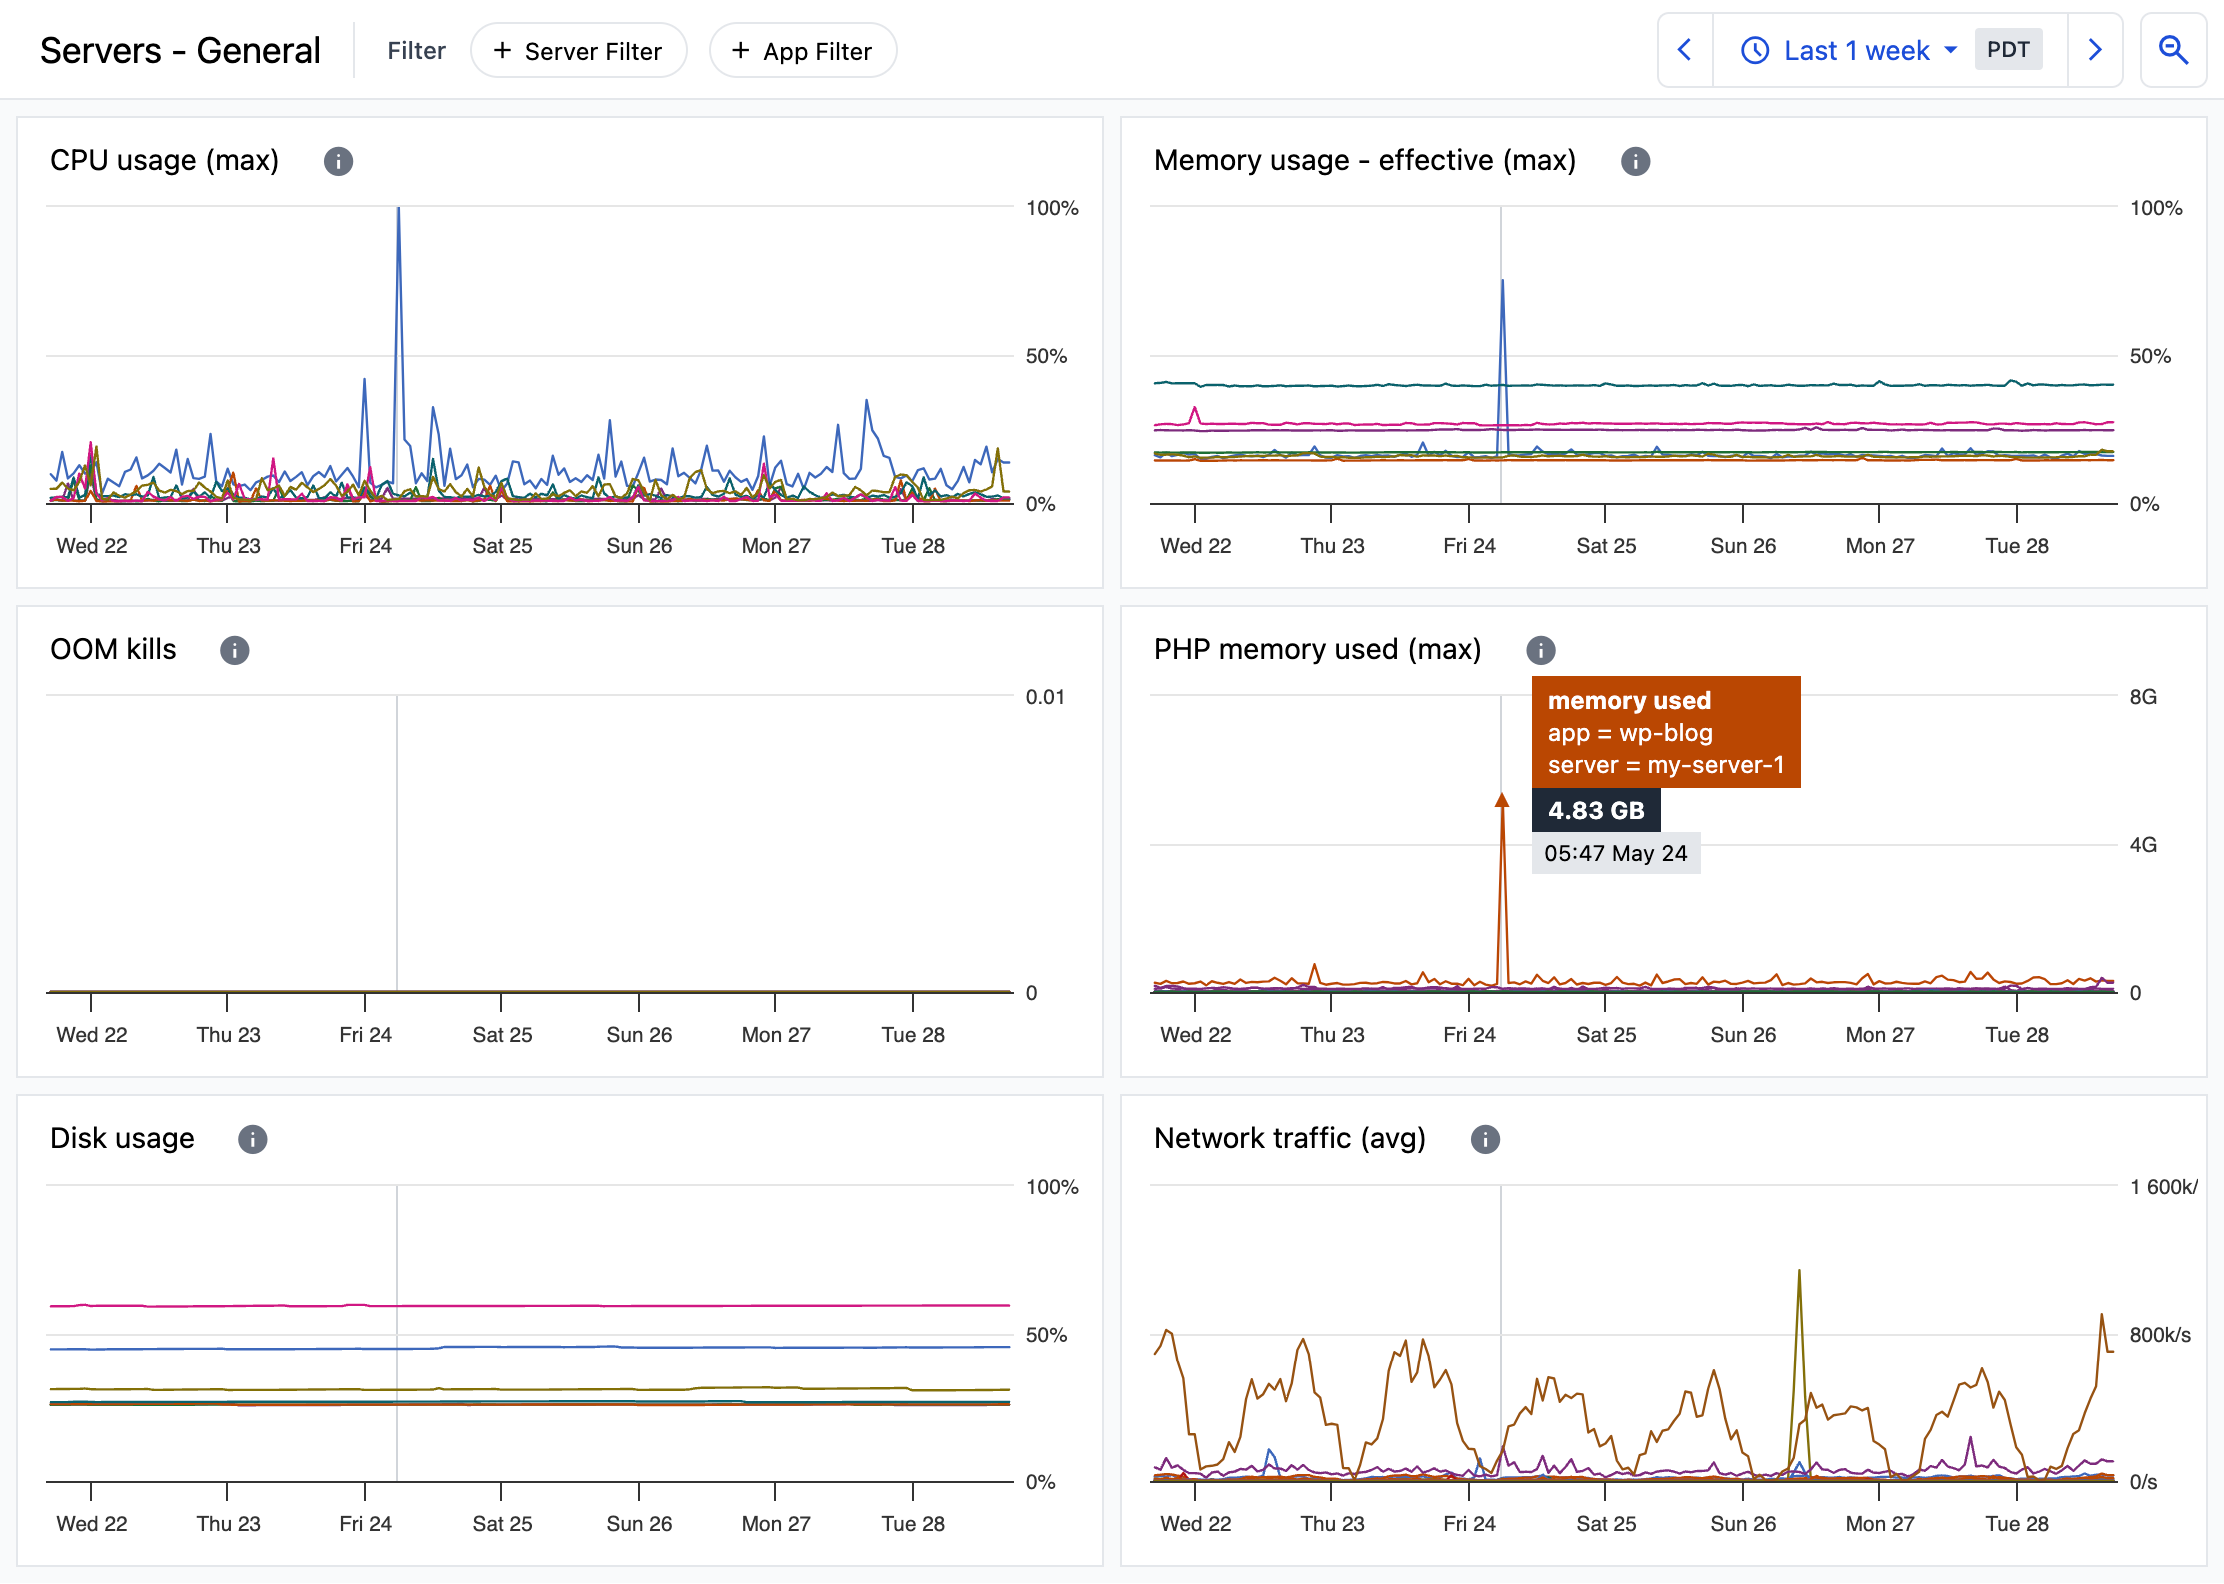
Example showing a few of the available server metrics.
CPU usage is broken down both as total CPU usage and per-core usage.
CPU iowait lets you see how much idle CPU time was due to waiting on disk I/O.
As raw memory usage doesn’t tell you how much memory is actually available, our effective memory usage chart does.
OOM kills tells you if the kernel’s out-of-memory (OOM) killer had to kill processes because a server ran out of memory.
Additional charts include disk usage, inode usage, swap usage, and more.
App Metrics
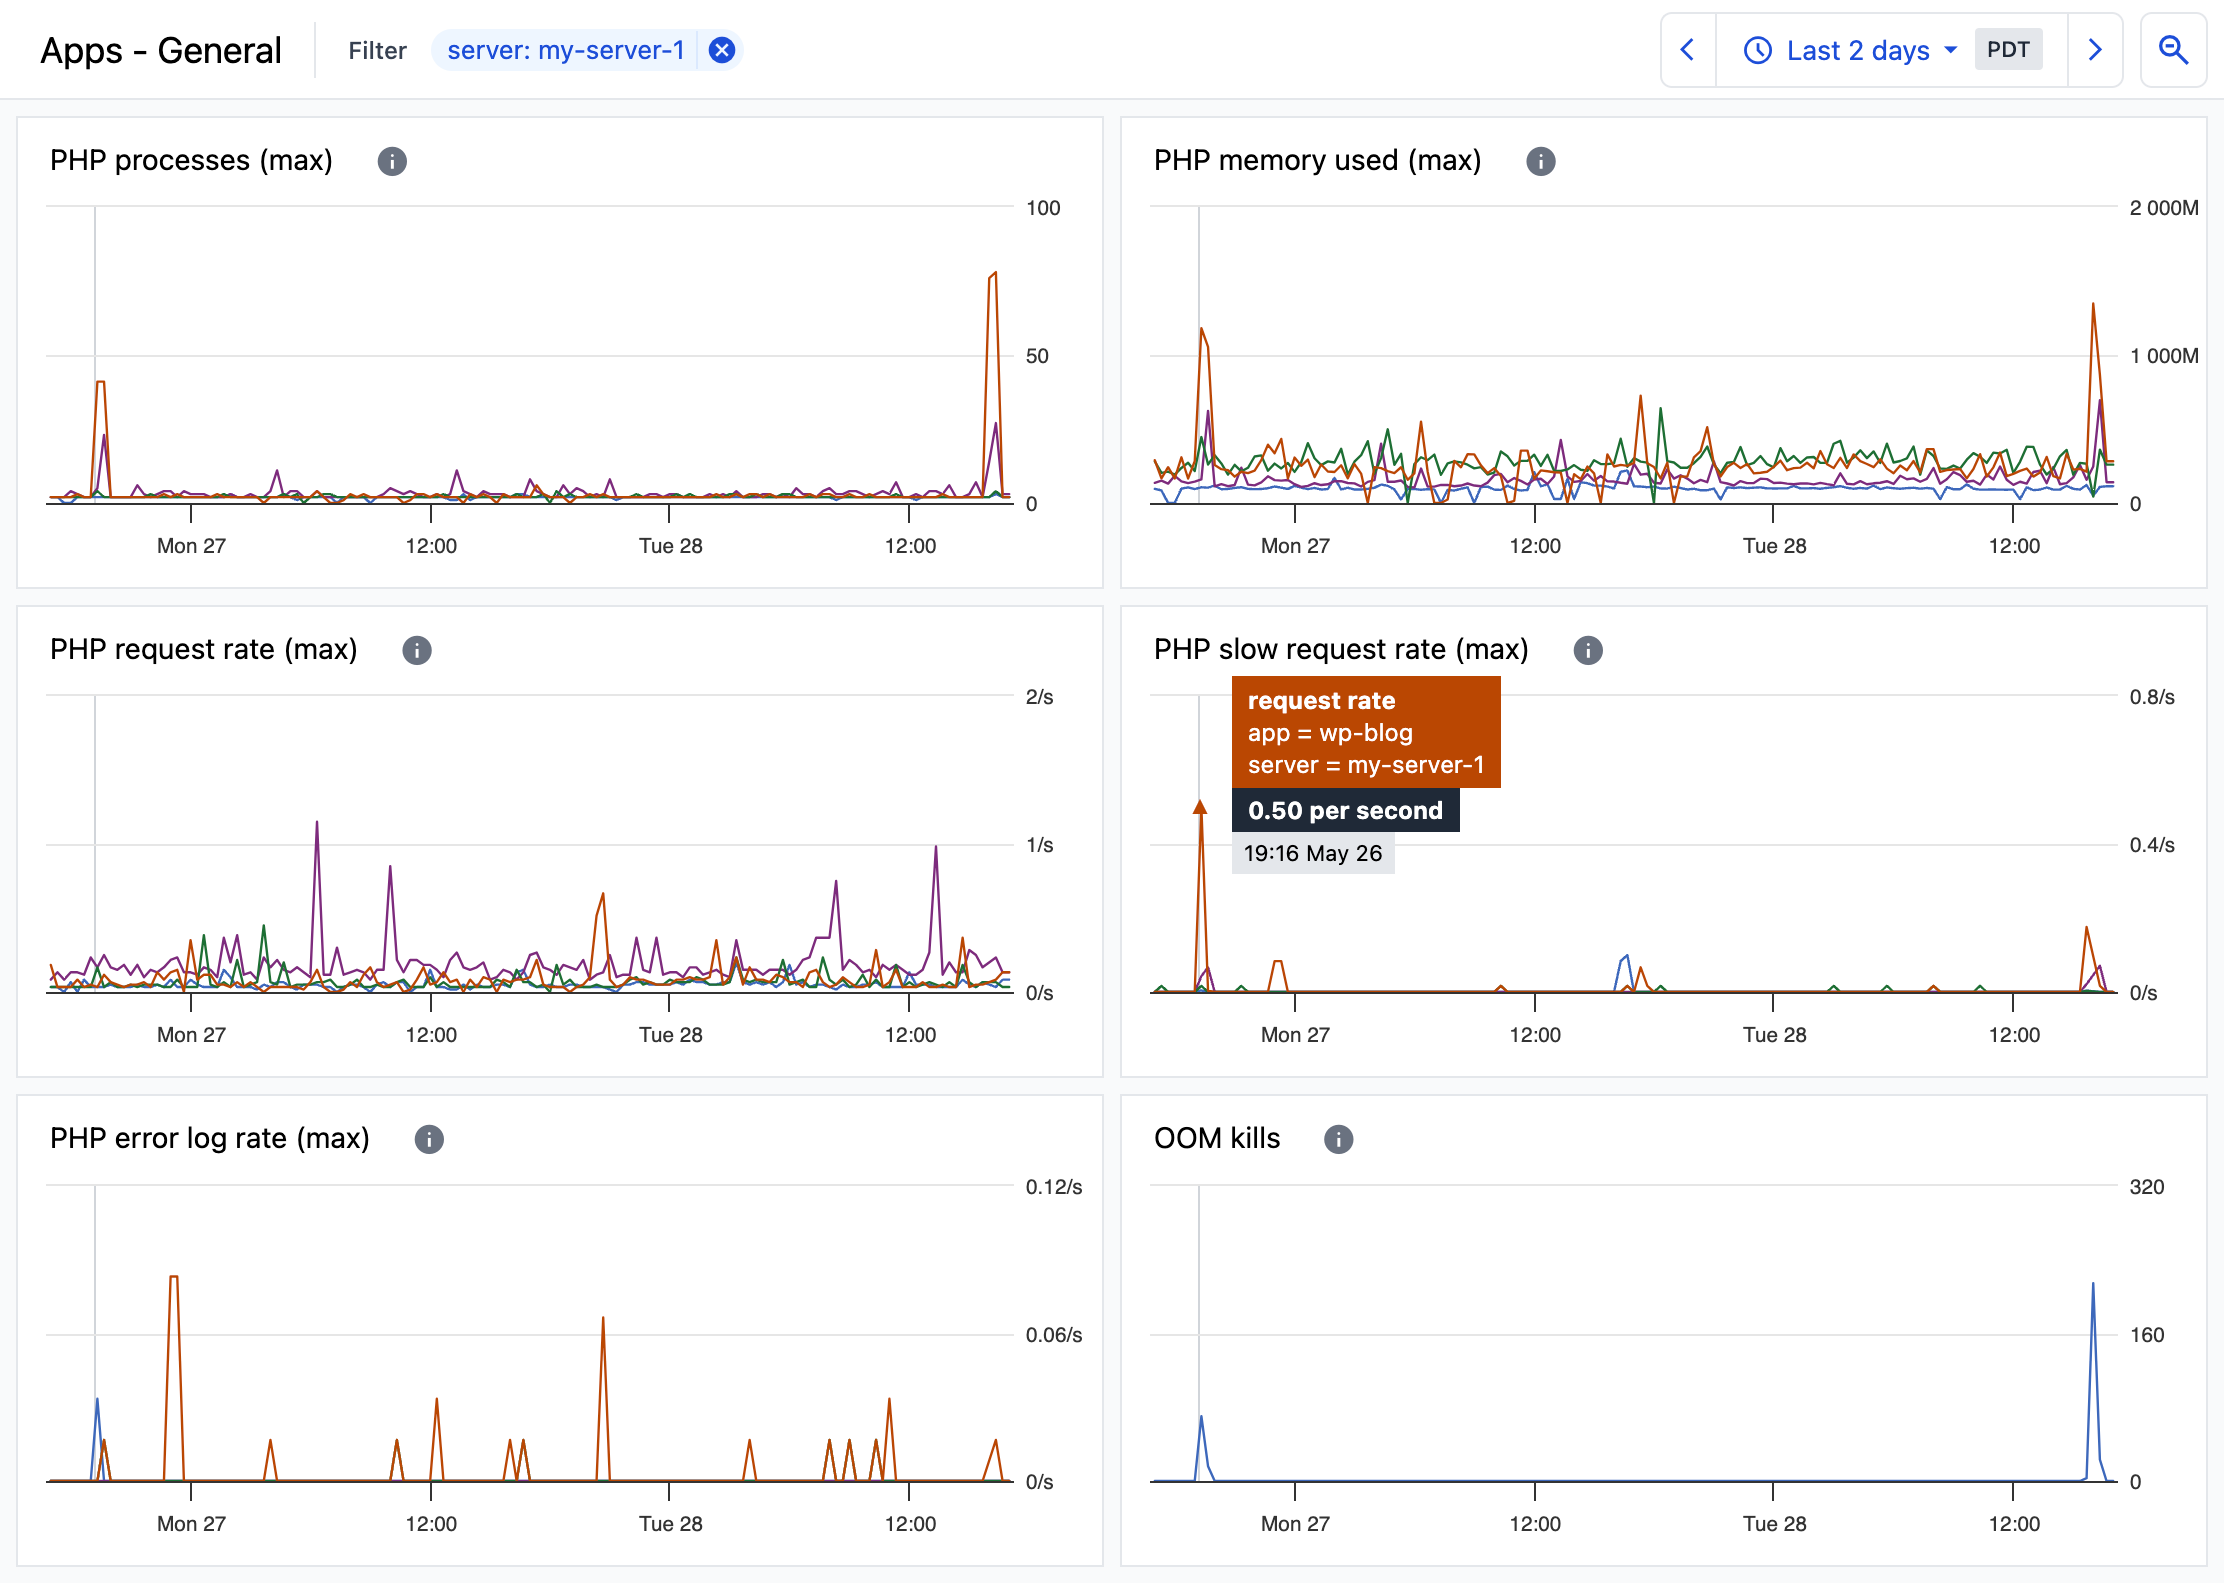
Example showing a few of the available app metrics.
PHP process count and PHP memory usage charts show you which apps are using the most memory due to their number of concurrently executing requests.
The rates of PHP requests and slow PHP requests show you how busy your apps are and how frequently response times are over five seconds.
Nginx requests and Apache requests tell you the total rate of requests to each app, including requests for static files.
Error log rates for PHP, Nginx, and Apache help you correlate errors with traffic spikes or periods of high CPU or memory usage.
MySQL Metrics
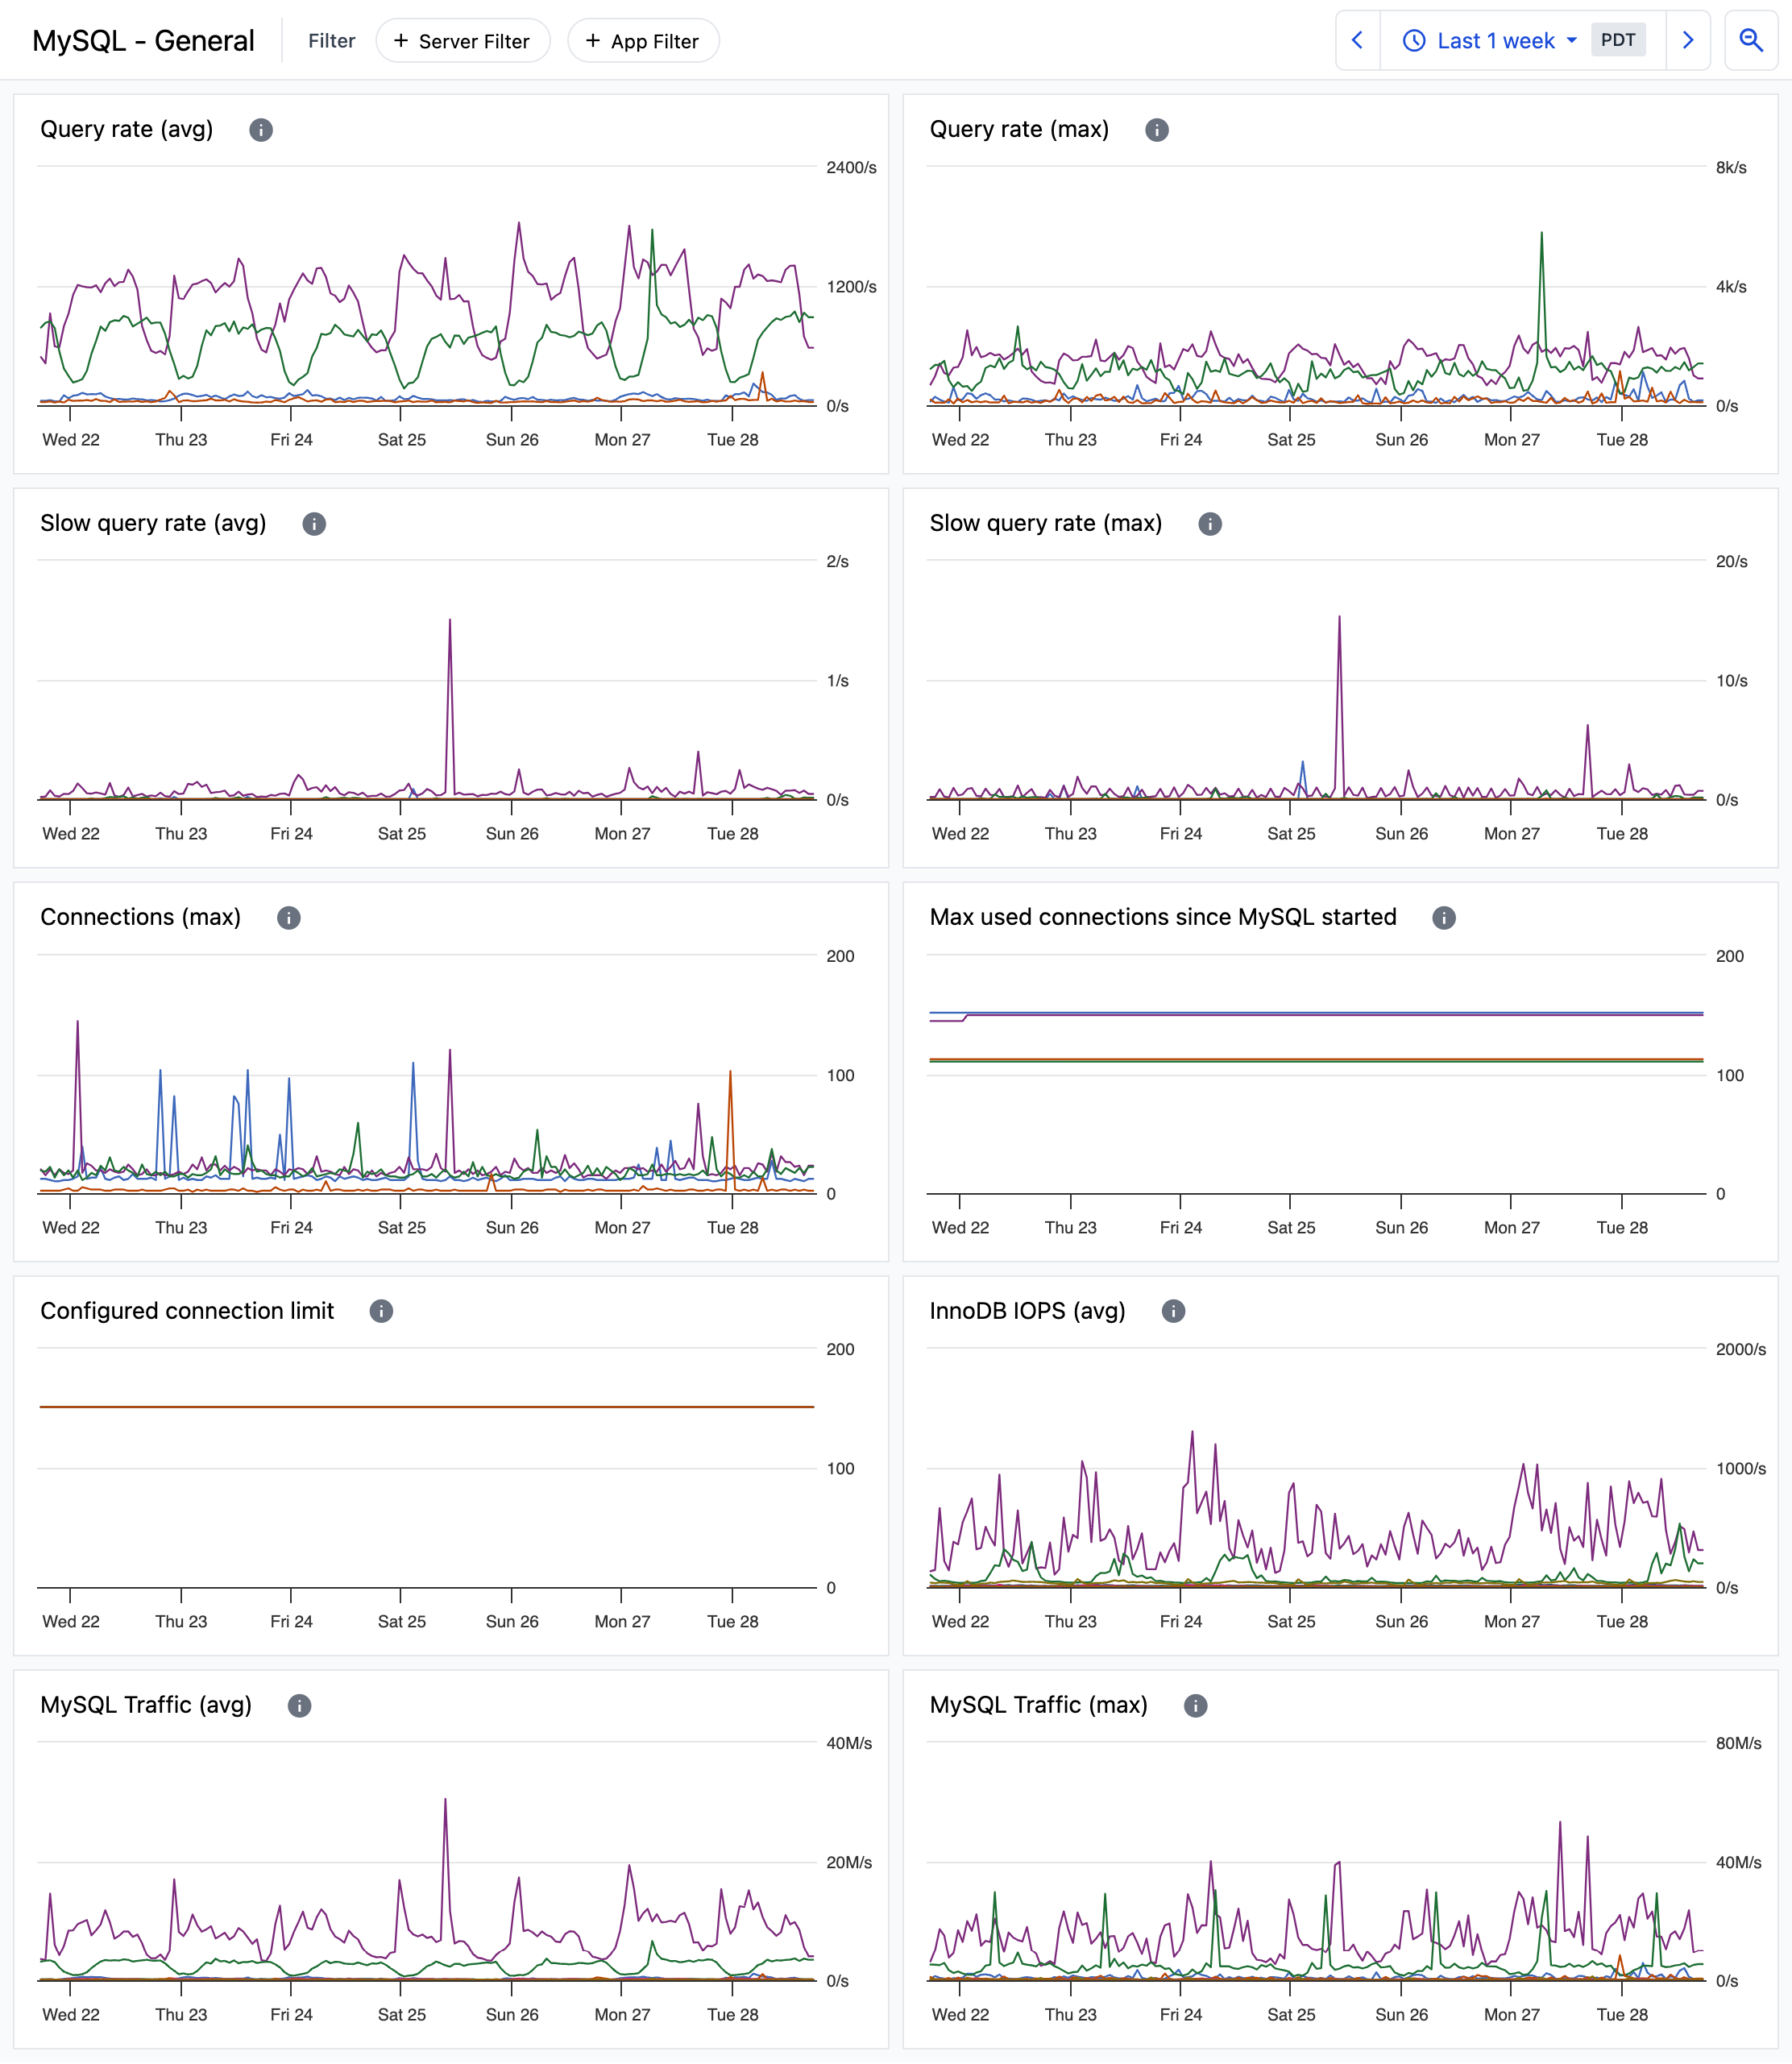
Example showing a few of the available MySQL metrics.
Query rate and slow query rate let you see how many queries MySQL is answering and how many are performing poorly.
Active MySQL connections along with max seen active connections since MySQL started and MySQL’s configured connection limit help you avoid problems without wasting memory.
Cache health including InnoDB buffer pool size and usage as well as open table cache size and usage ensure you know that cache sizes are large enough for your workloads.
Other charts include InnoDB IOPS (disk read/write rates), MySQL traffic, and more.
Beyond Averages
Many resource limitations and performance bottlenecks cannot be seen by looking at averages alone.
When you view a one-week chart of server CPU usage at your cloud provider (or with any monitoring tool), the chart does not show every raw, per-minute data point. If it did, you’d see an unreadable mess of lines connecting over 10,000 points. Instead, a single data point may be used to represent each hour. Commonly, the raw values within that hour are averaged to generate a single data point.
Though averages are useful, what they don’t tell you are maximum values. That is, averages don’t let you see peaks. The CPU usage charts below show an example.
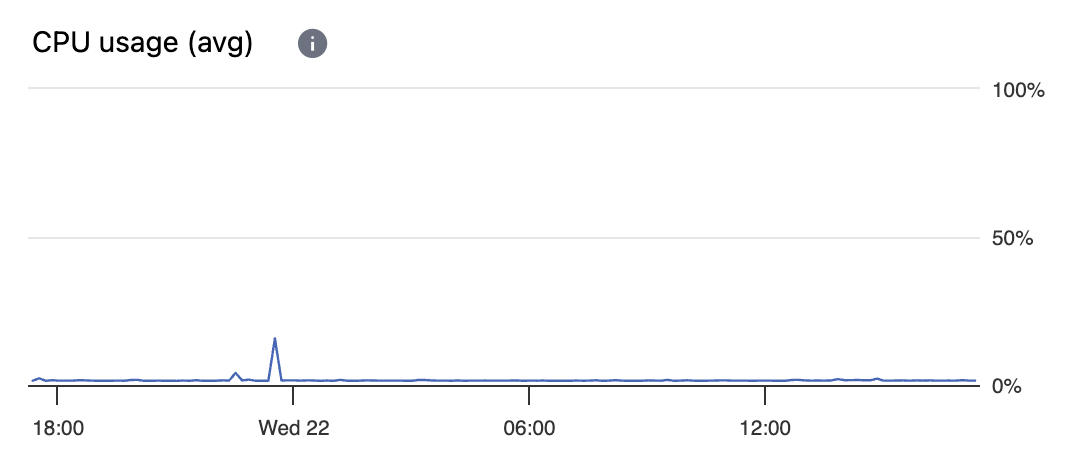
Chart of average CPU usage that hides a peak value.
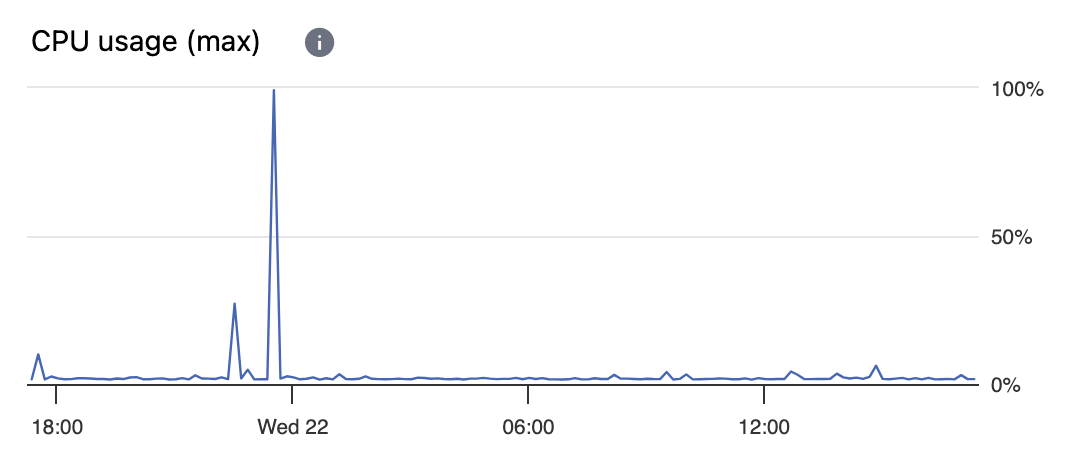
Chart of max CPU usage that provides missing information.
Learn more about ServerPilot’s features for hosting WordPress and PHP on cloud servers.