
View dashboards of server and app metrics
Dashboards
Monitoring dashboards can be accessed in ServerPilot by clicking Monitoring at the top of the page.
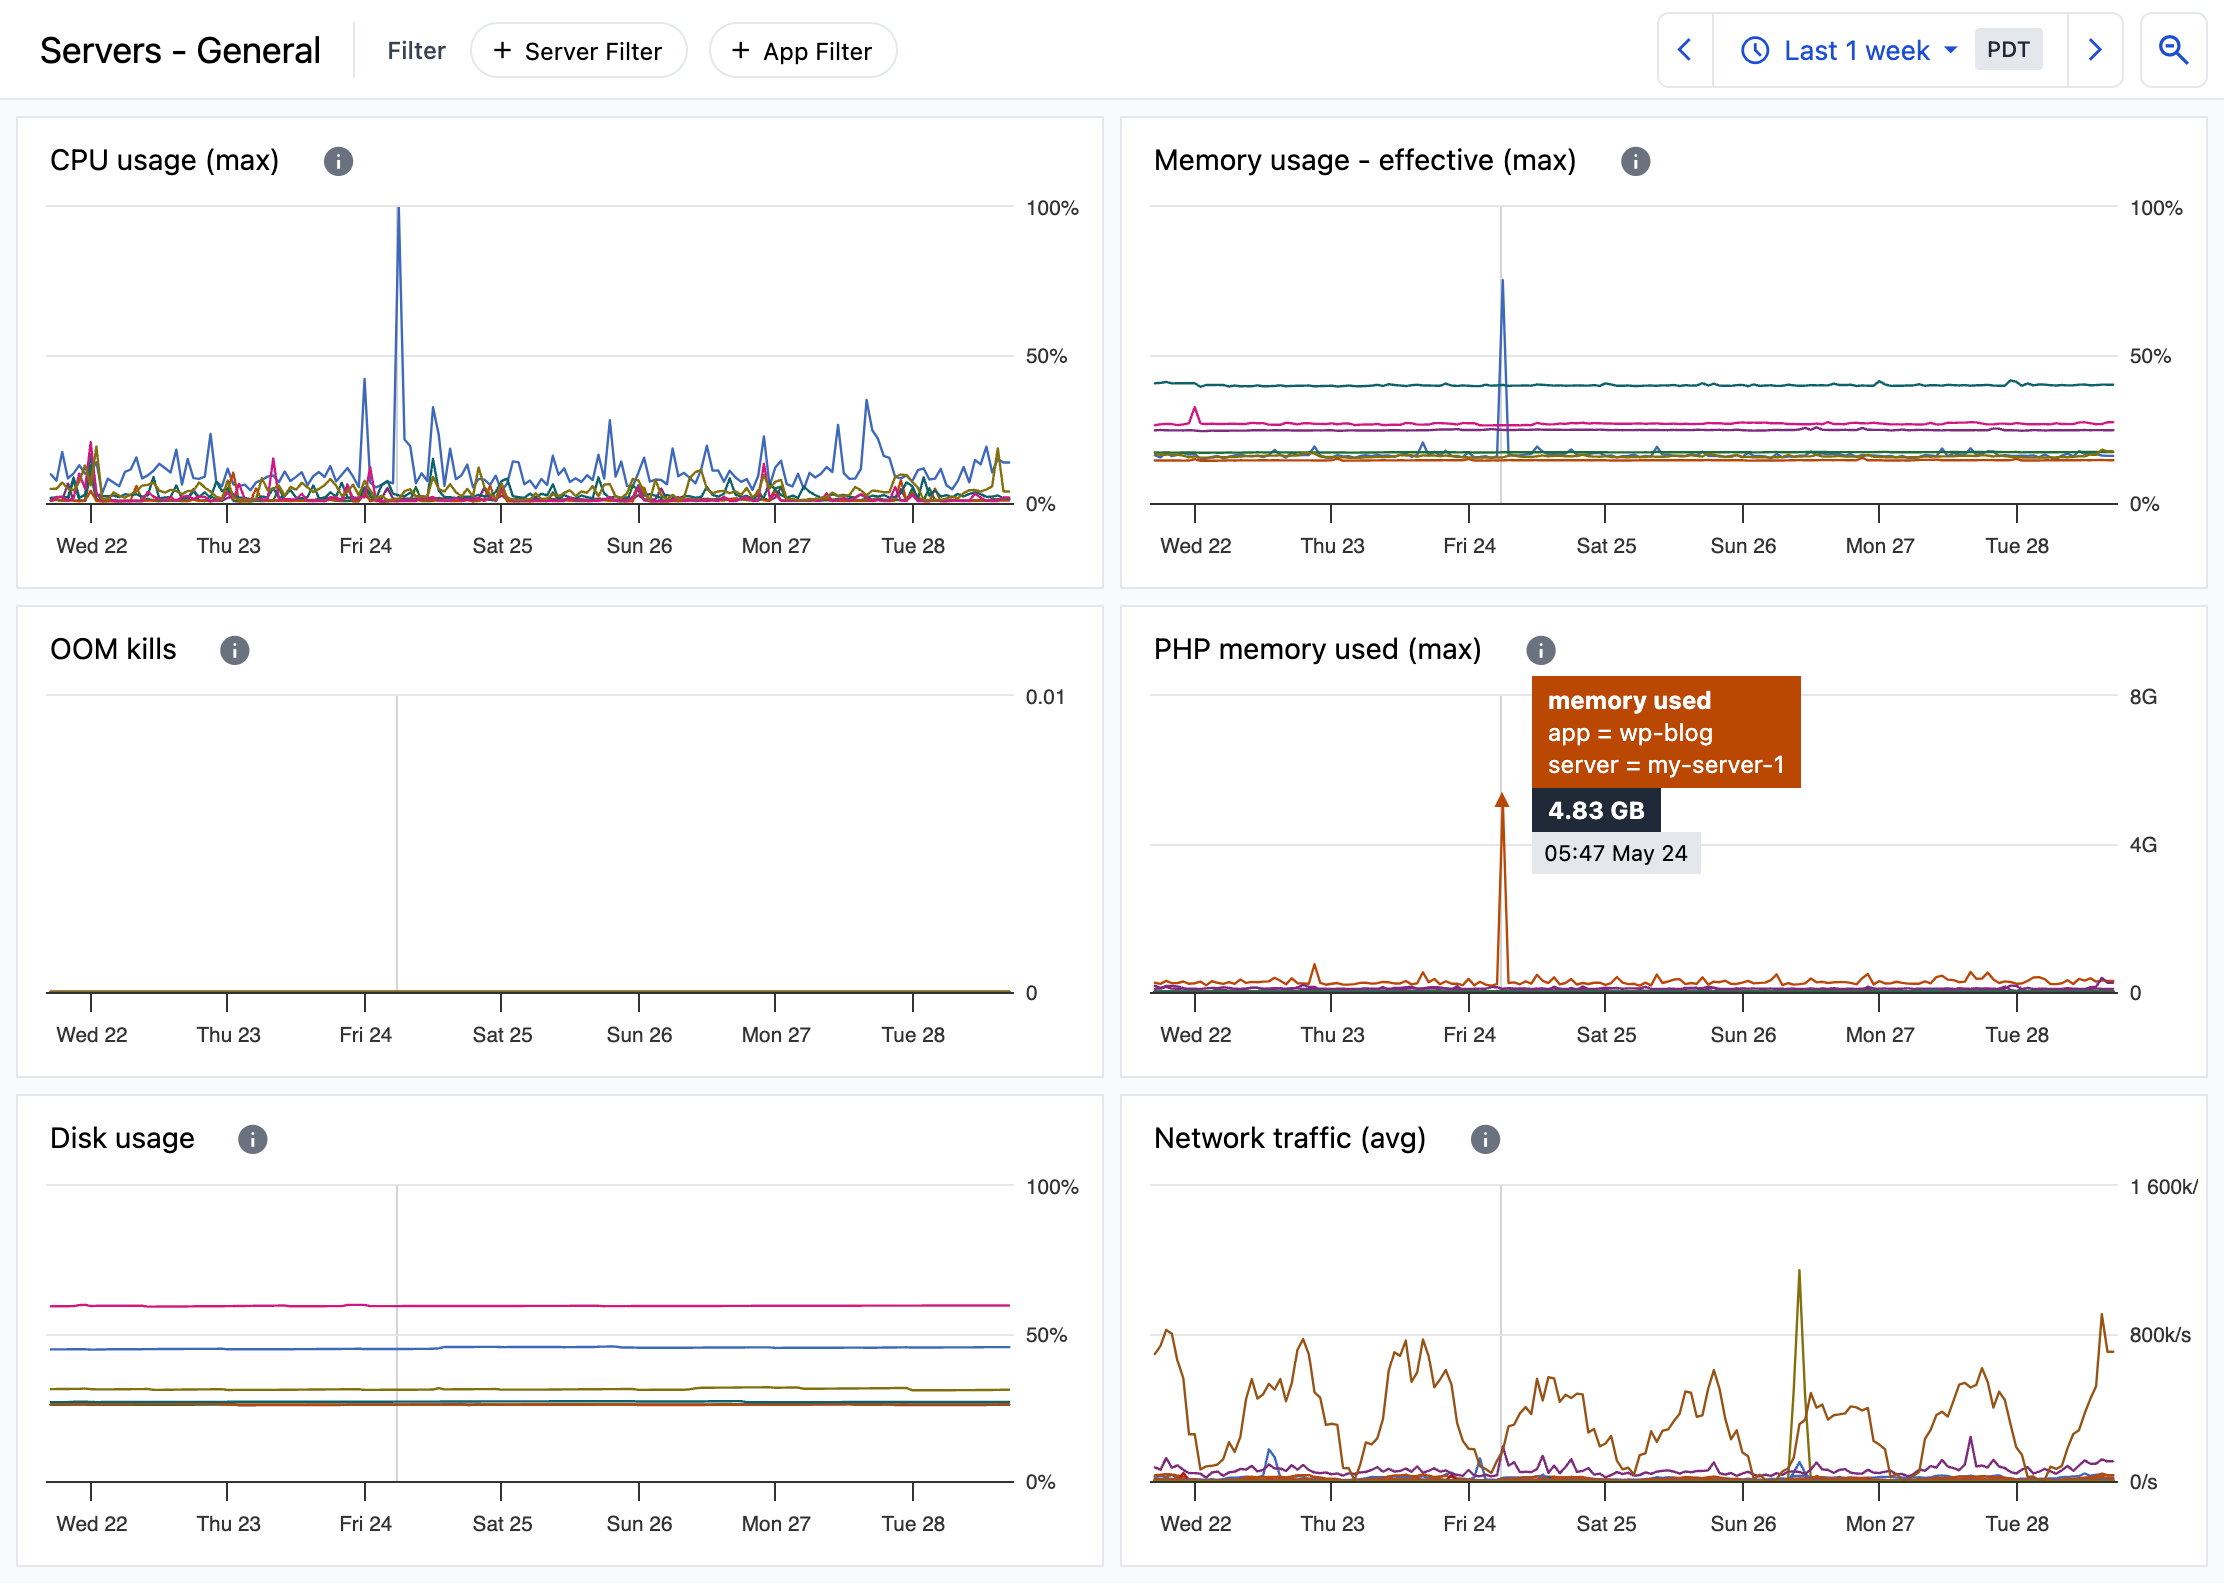
Server health overview
The Servers - General dashboard provides an overview of server health with metrics that give quick insight into the status of your servers.
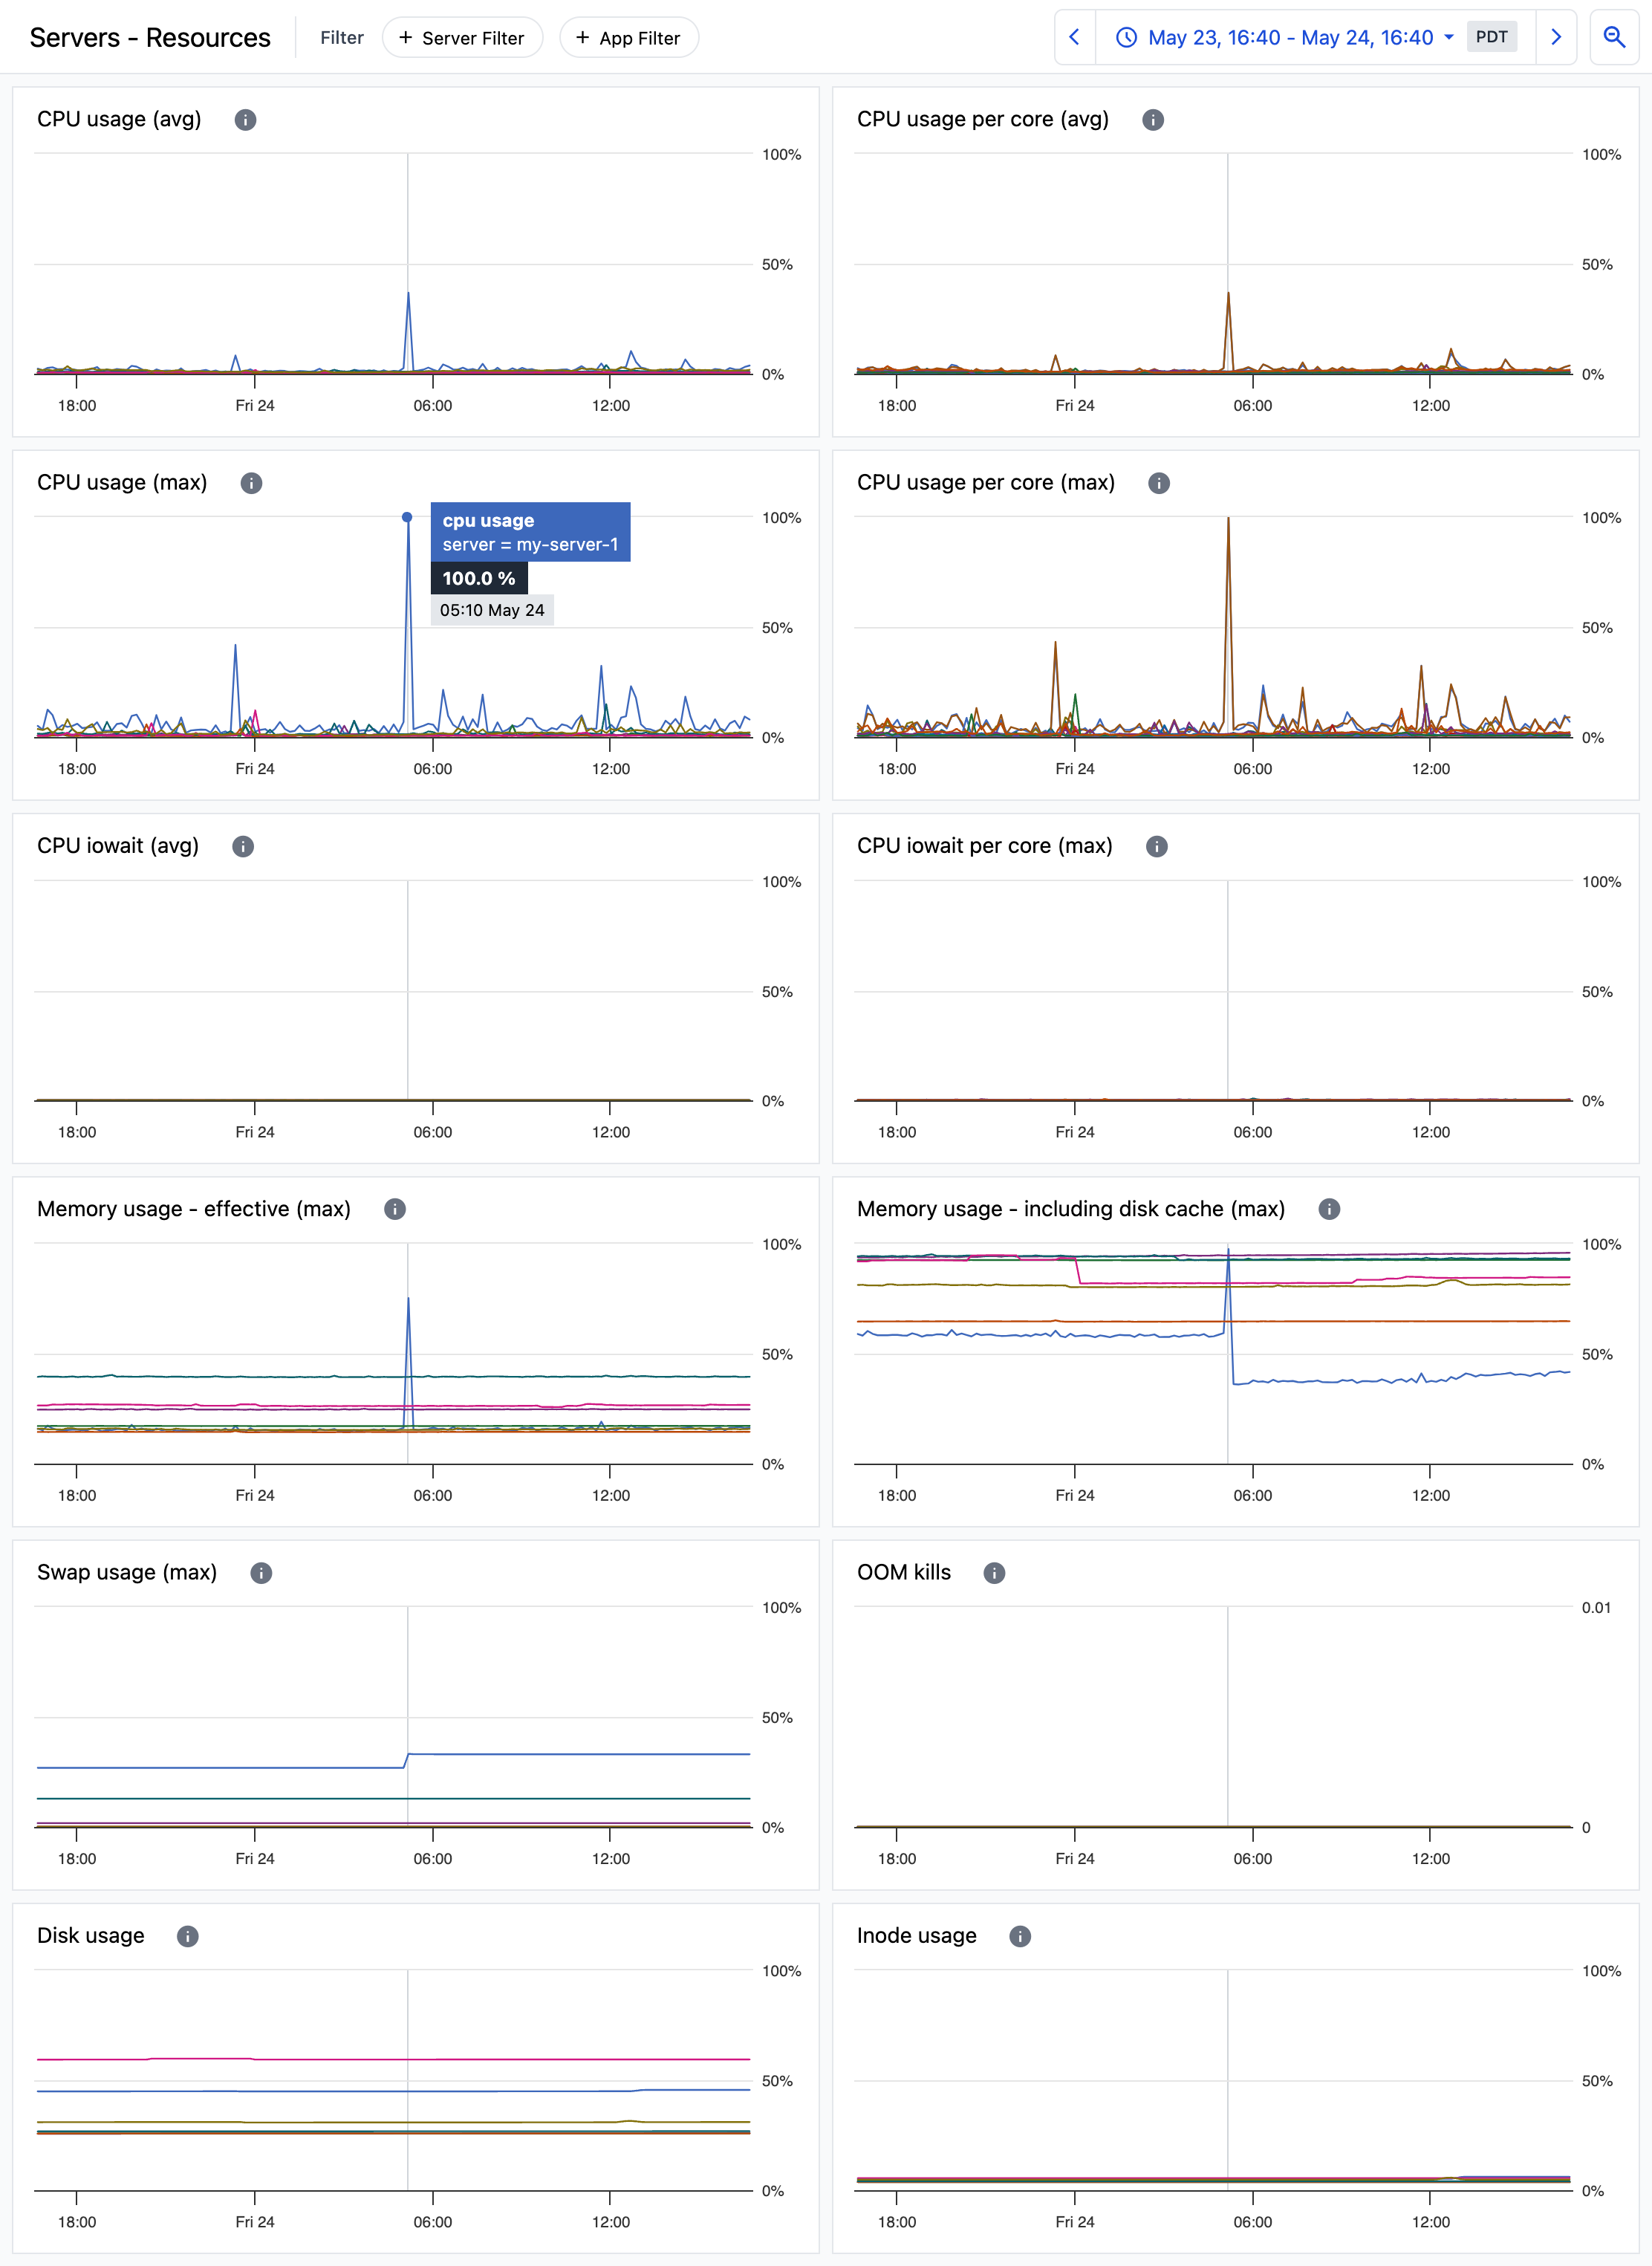
Server resource usage
The Servers - Resources dashboard provides a more detailed view of resource usage with metrics that give deeper insight into resource usage patterns.
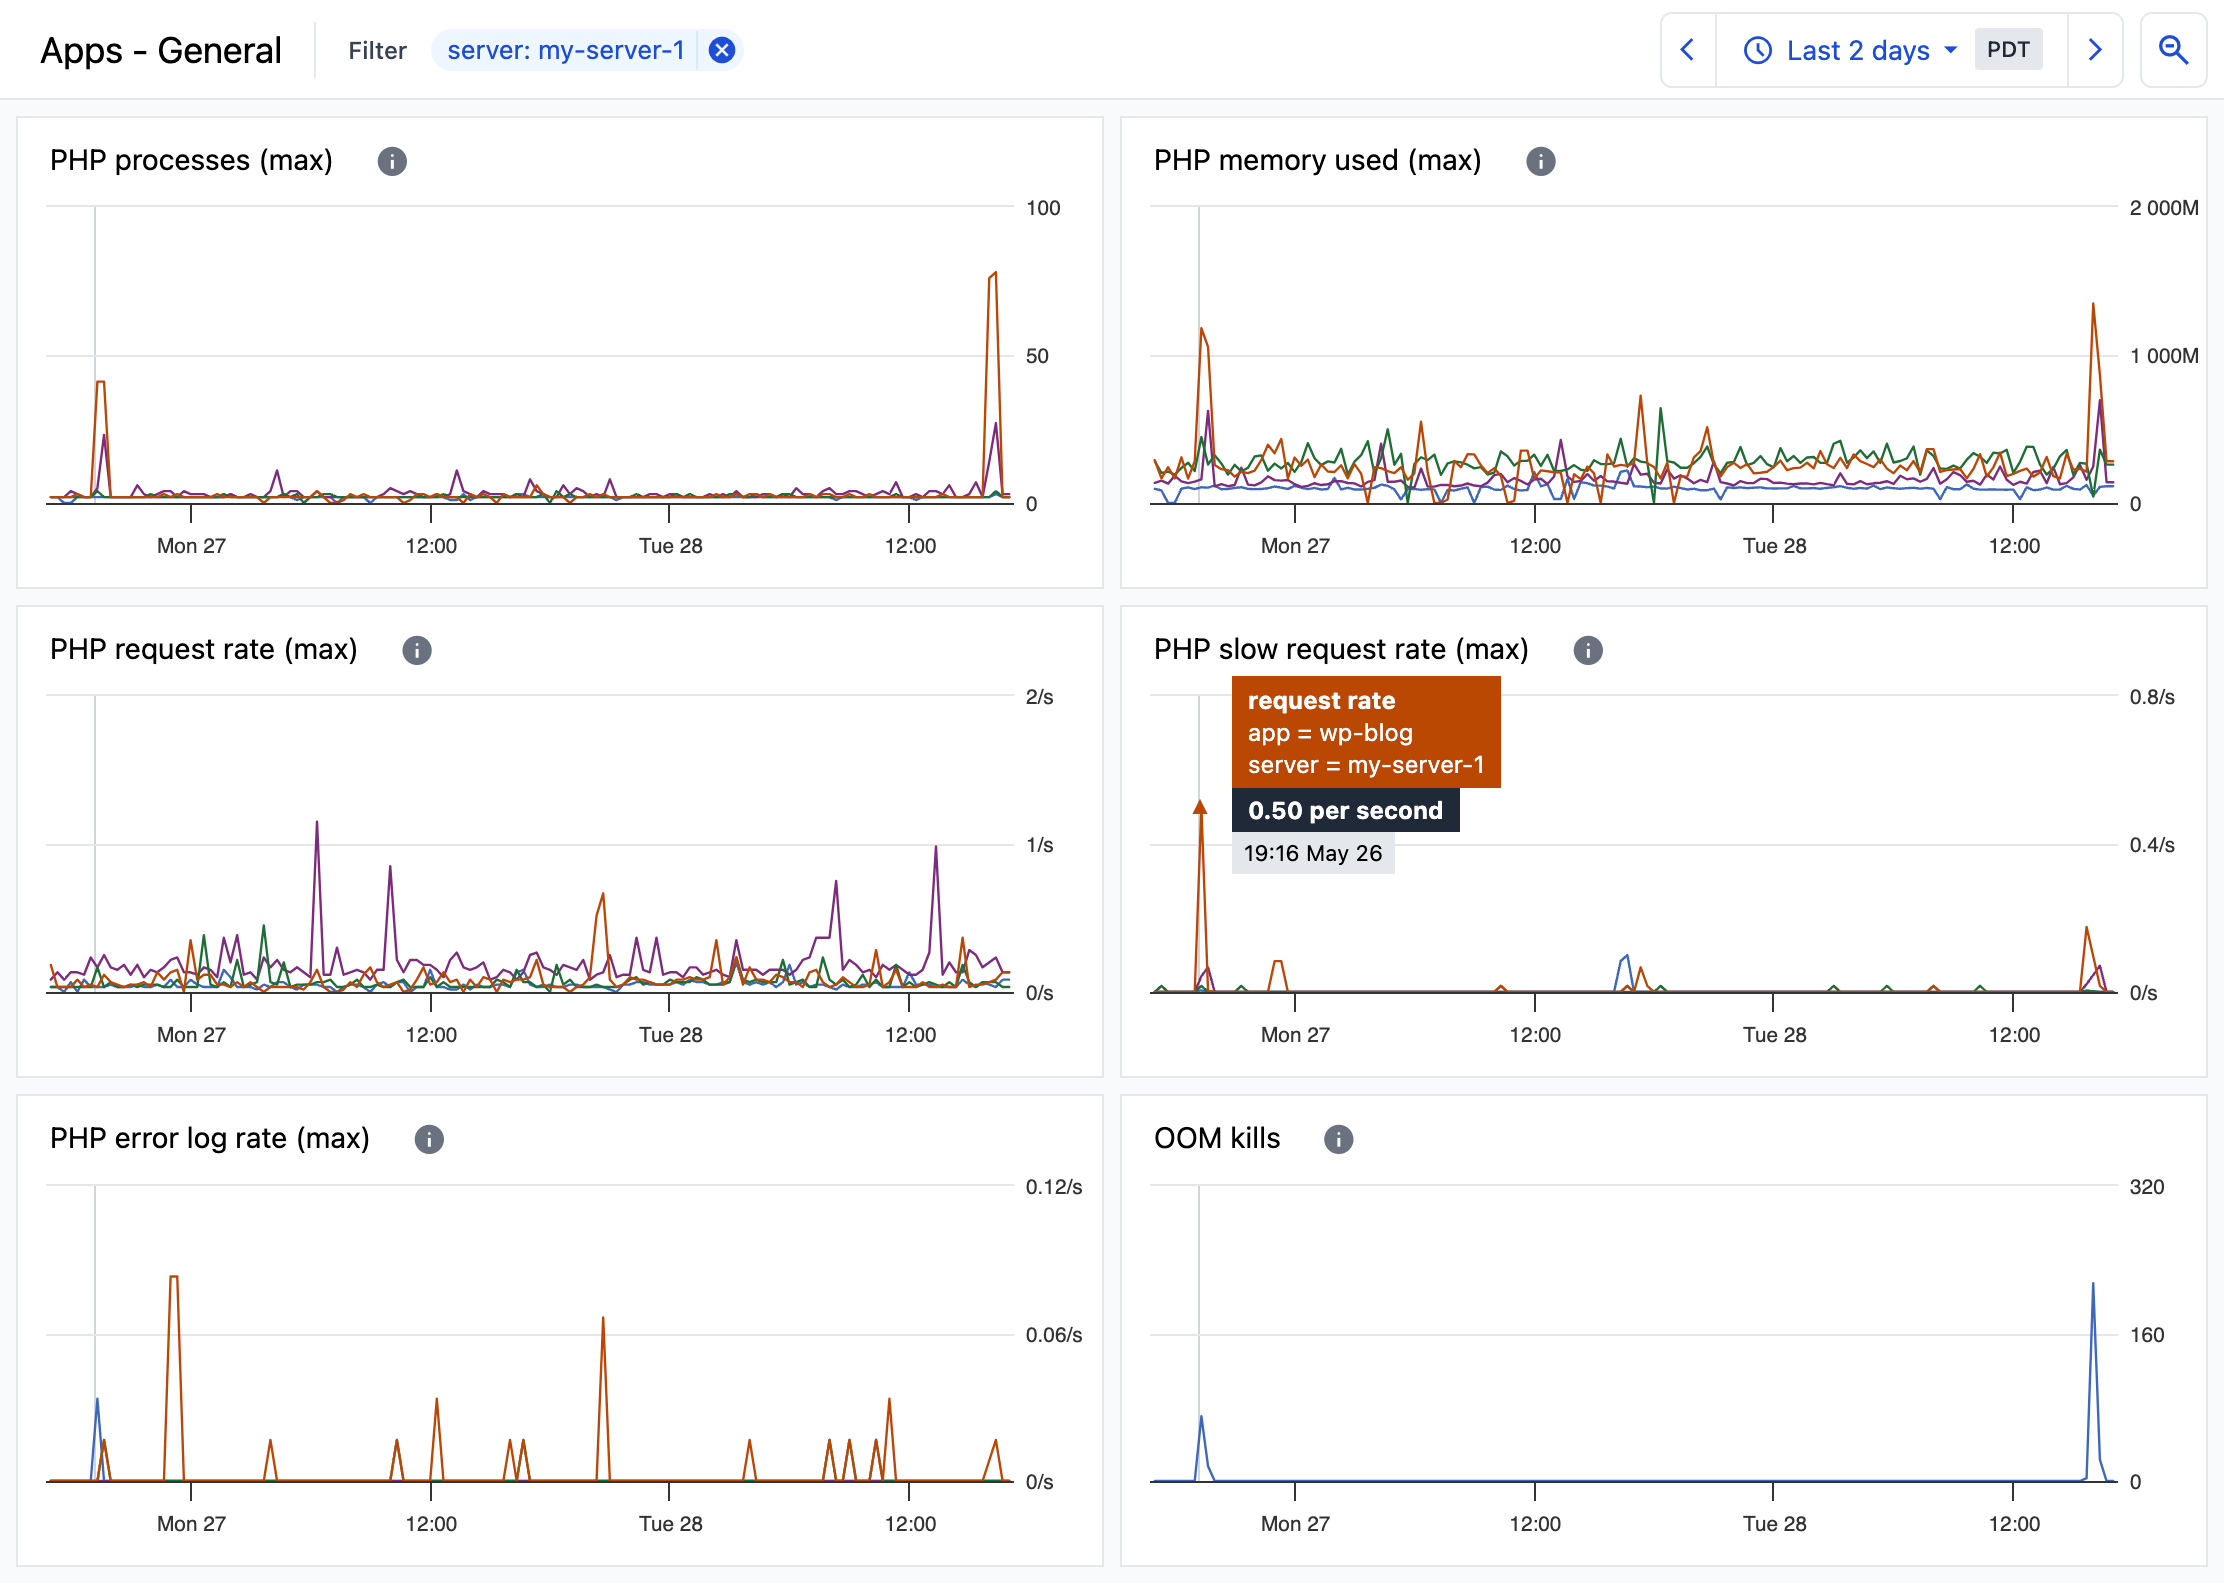
App health overview
The Apps - General dashboard provides an overview of your apps for insight into each app’s resource usage and requests.
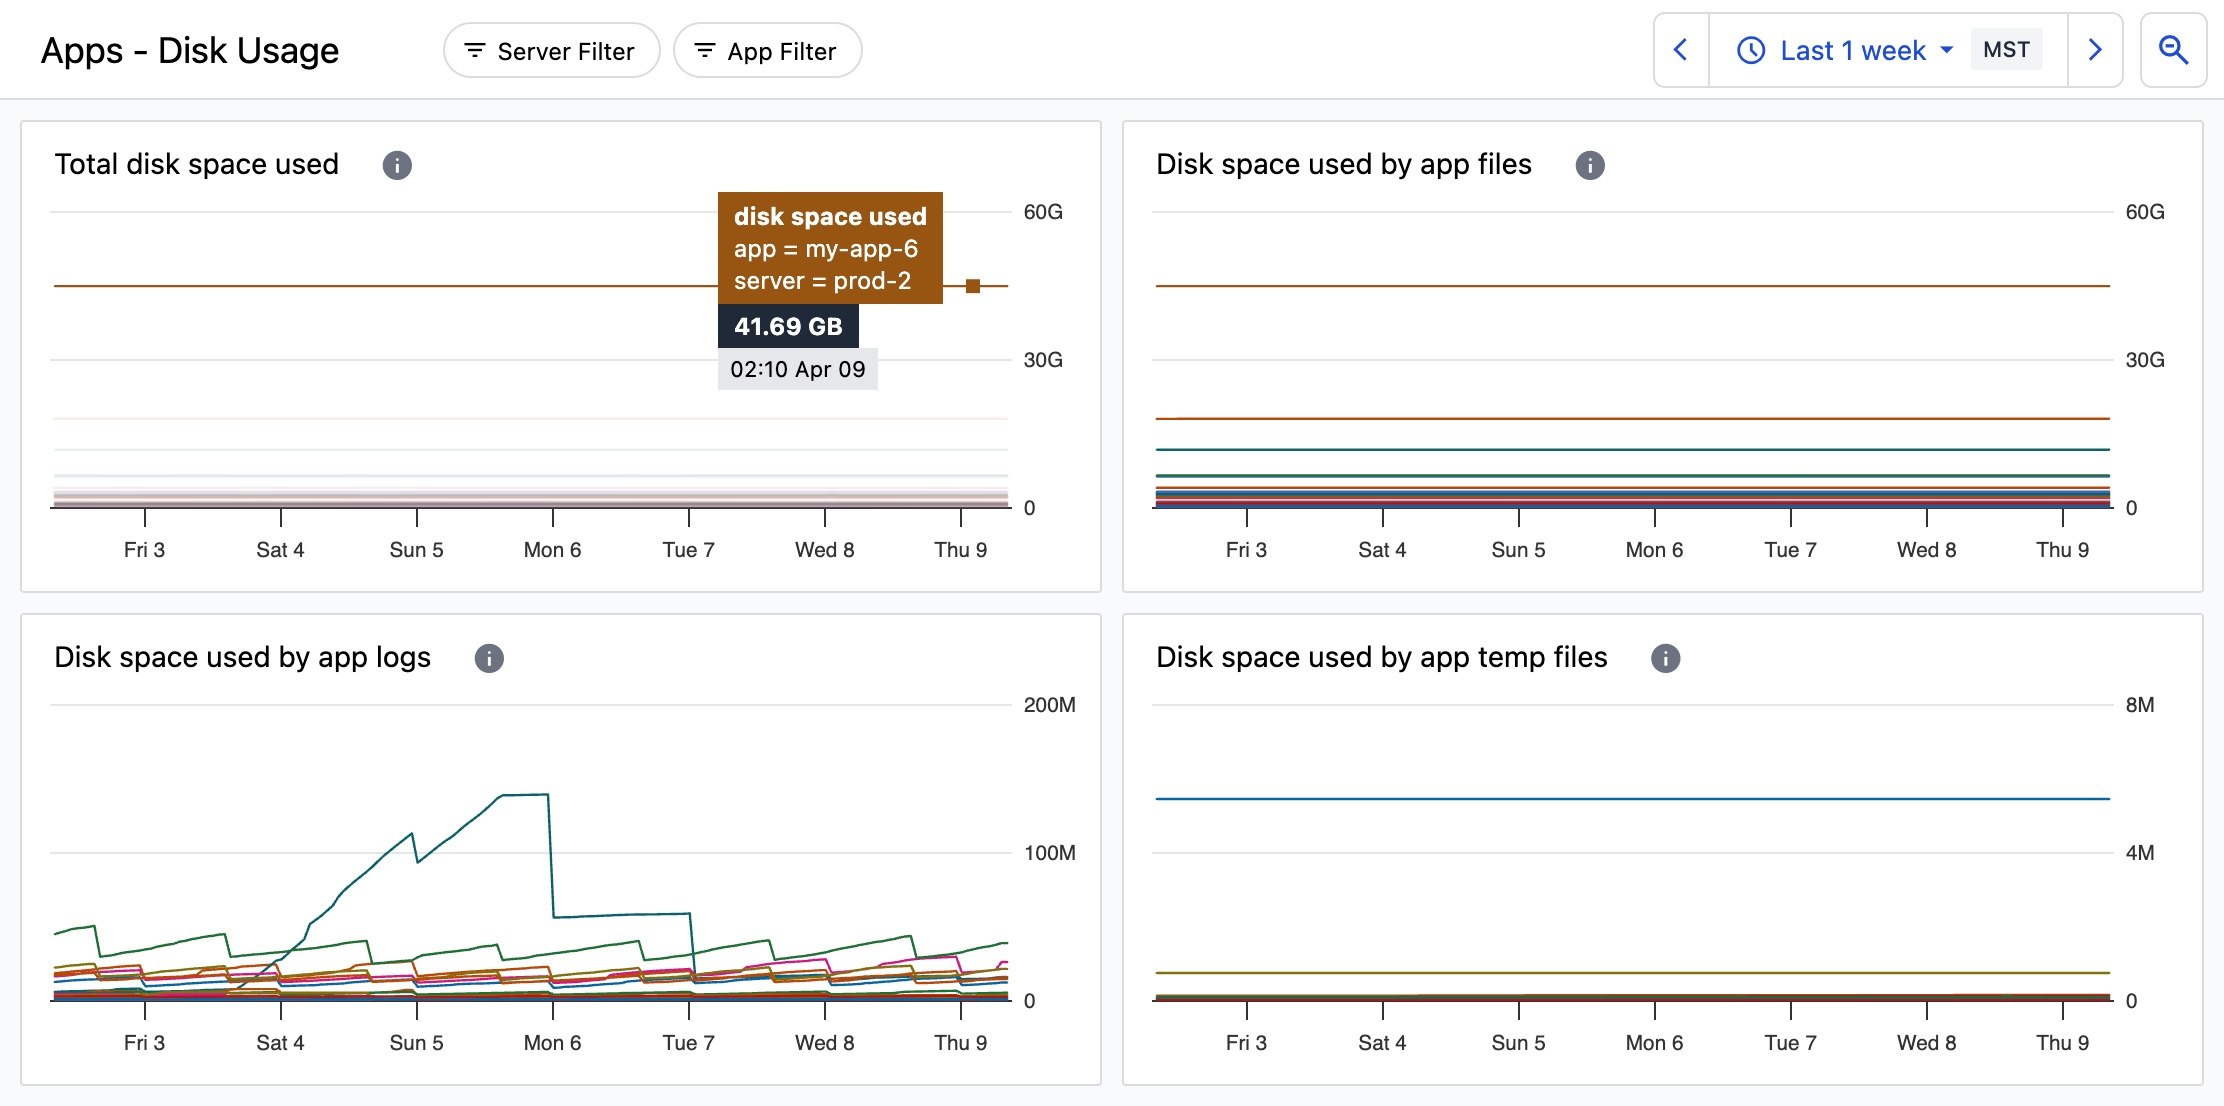
App disk usage
The Apps - Disk Usage dashboard provides disk usage information for each app, including total disk usage as well as specific types of disk usage.
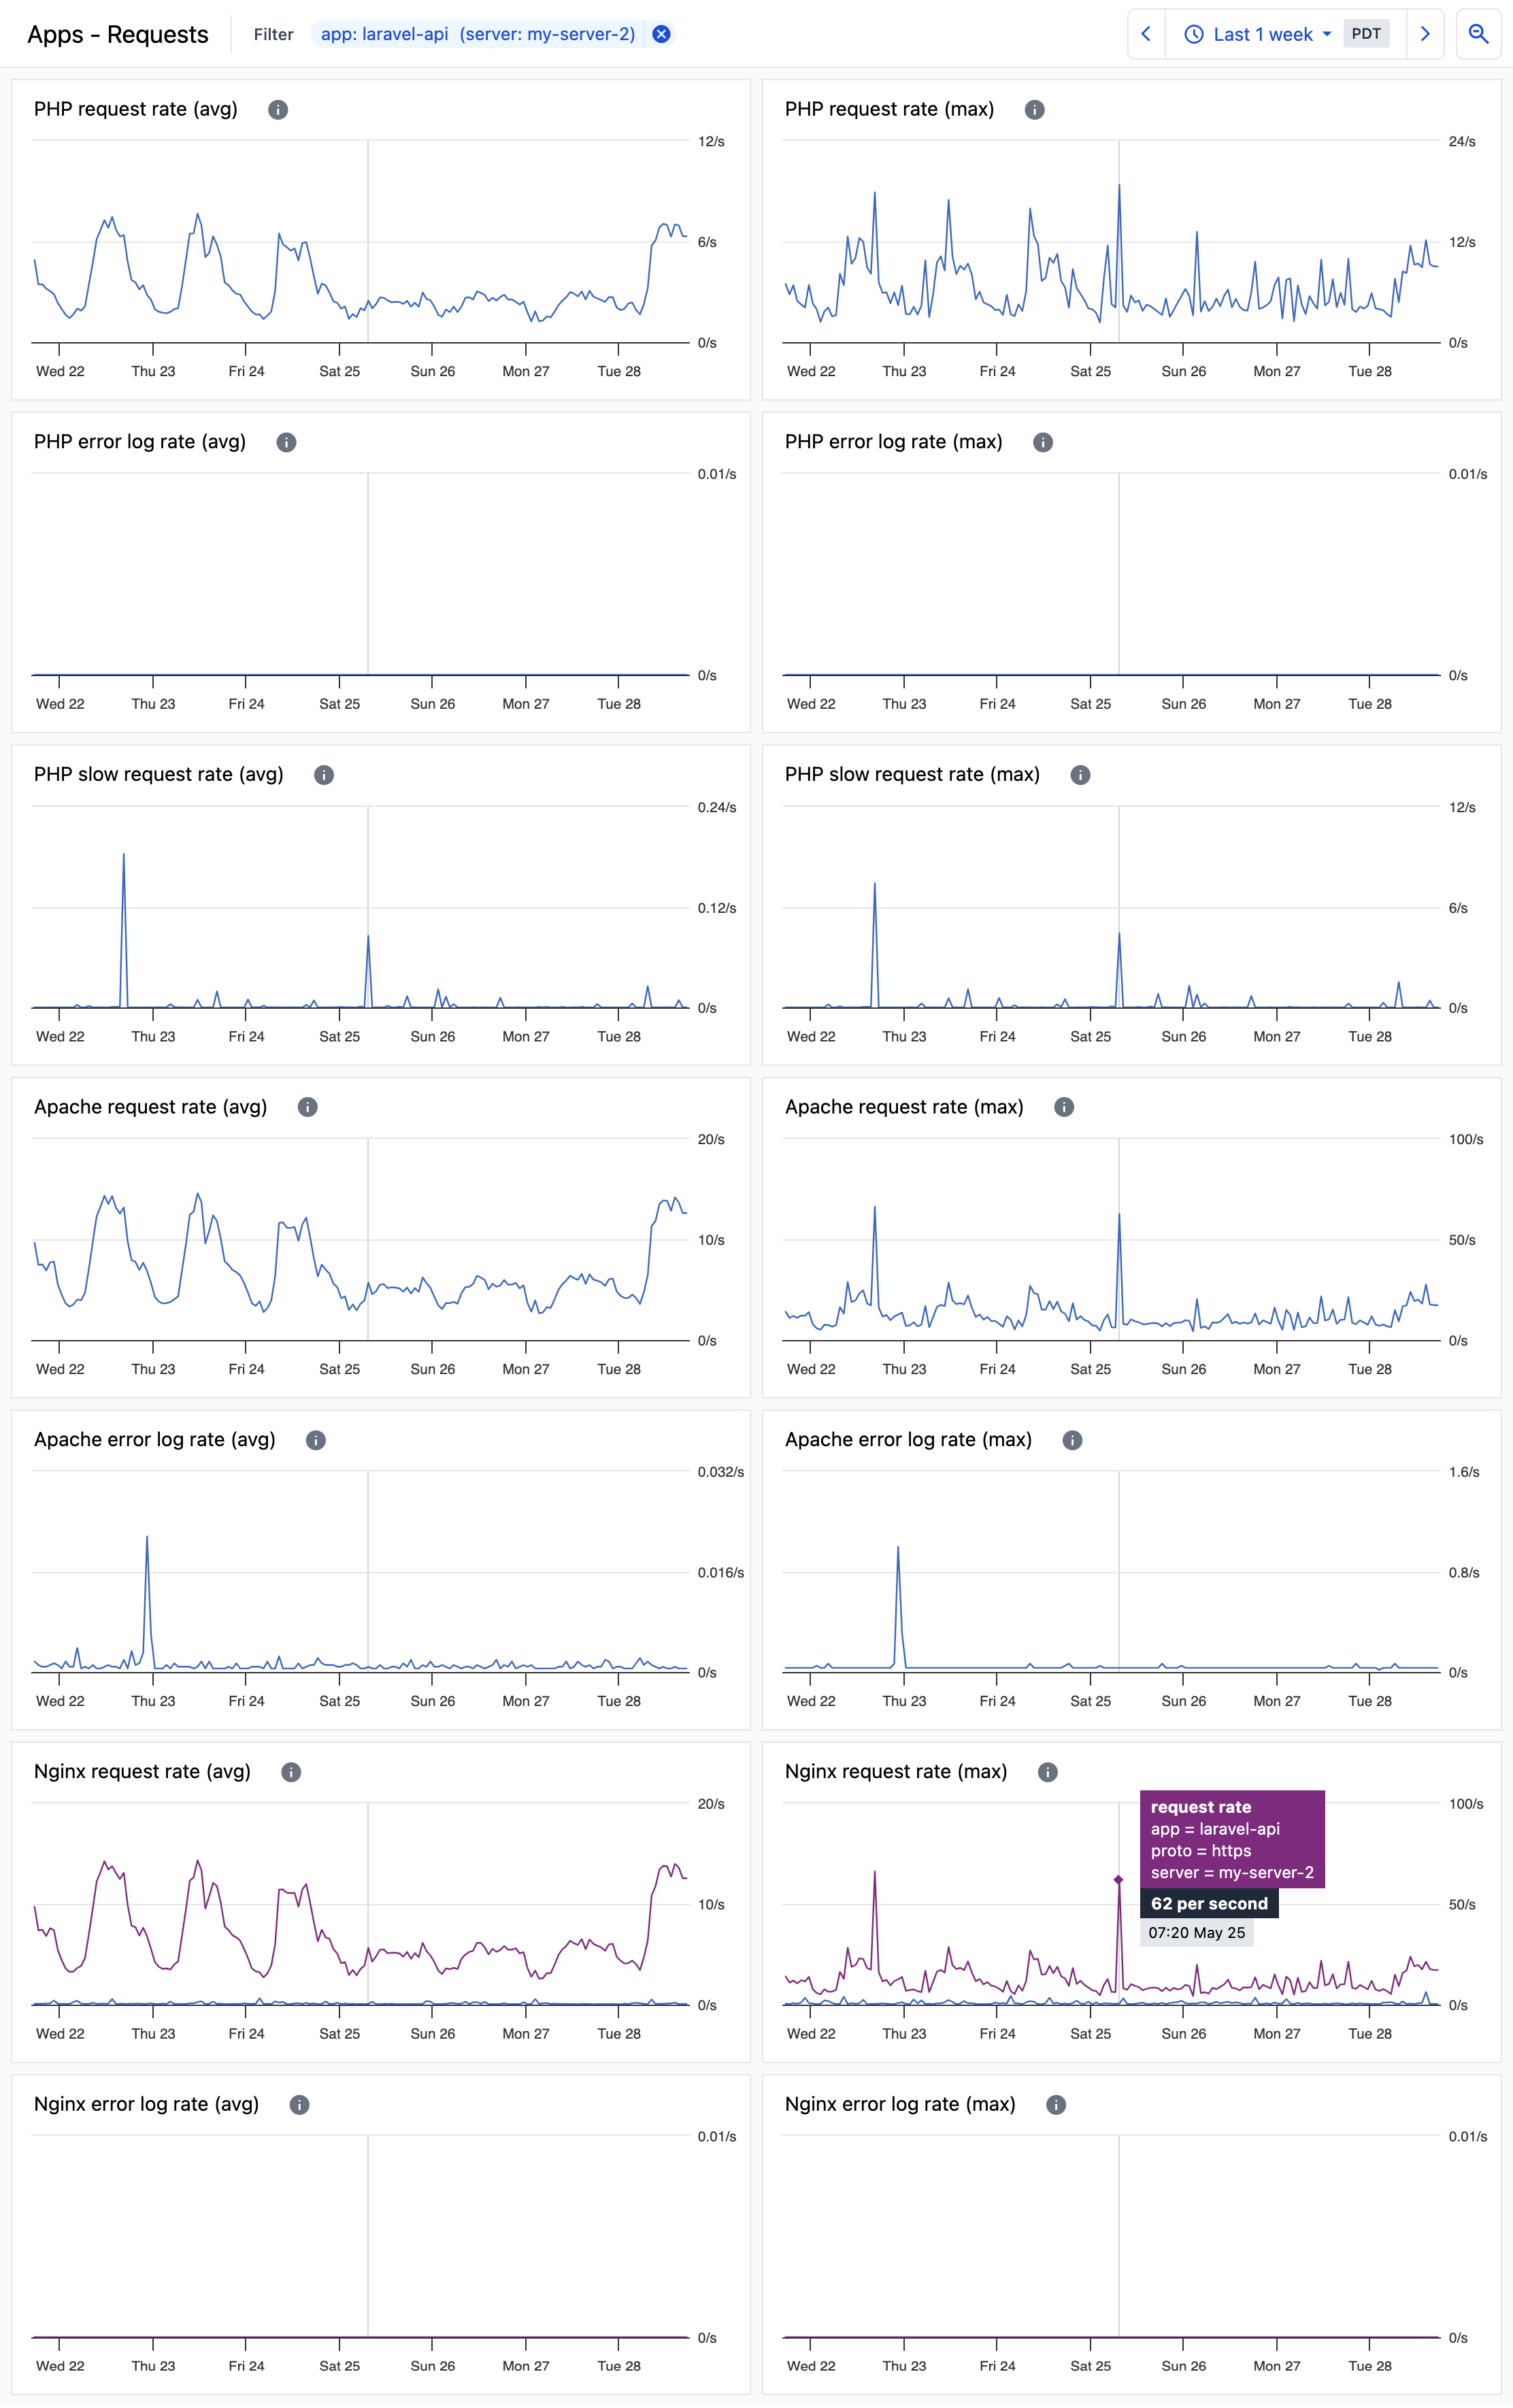
App requests and errors
The Apps - Requests dashboard provides information about each app’s request rates and errors.
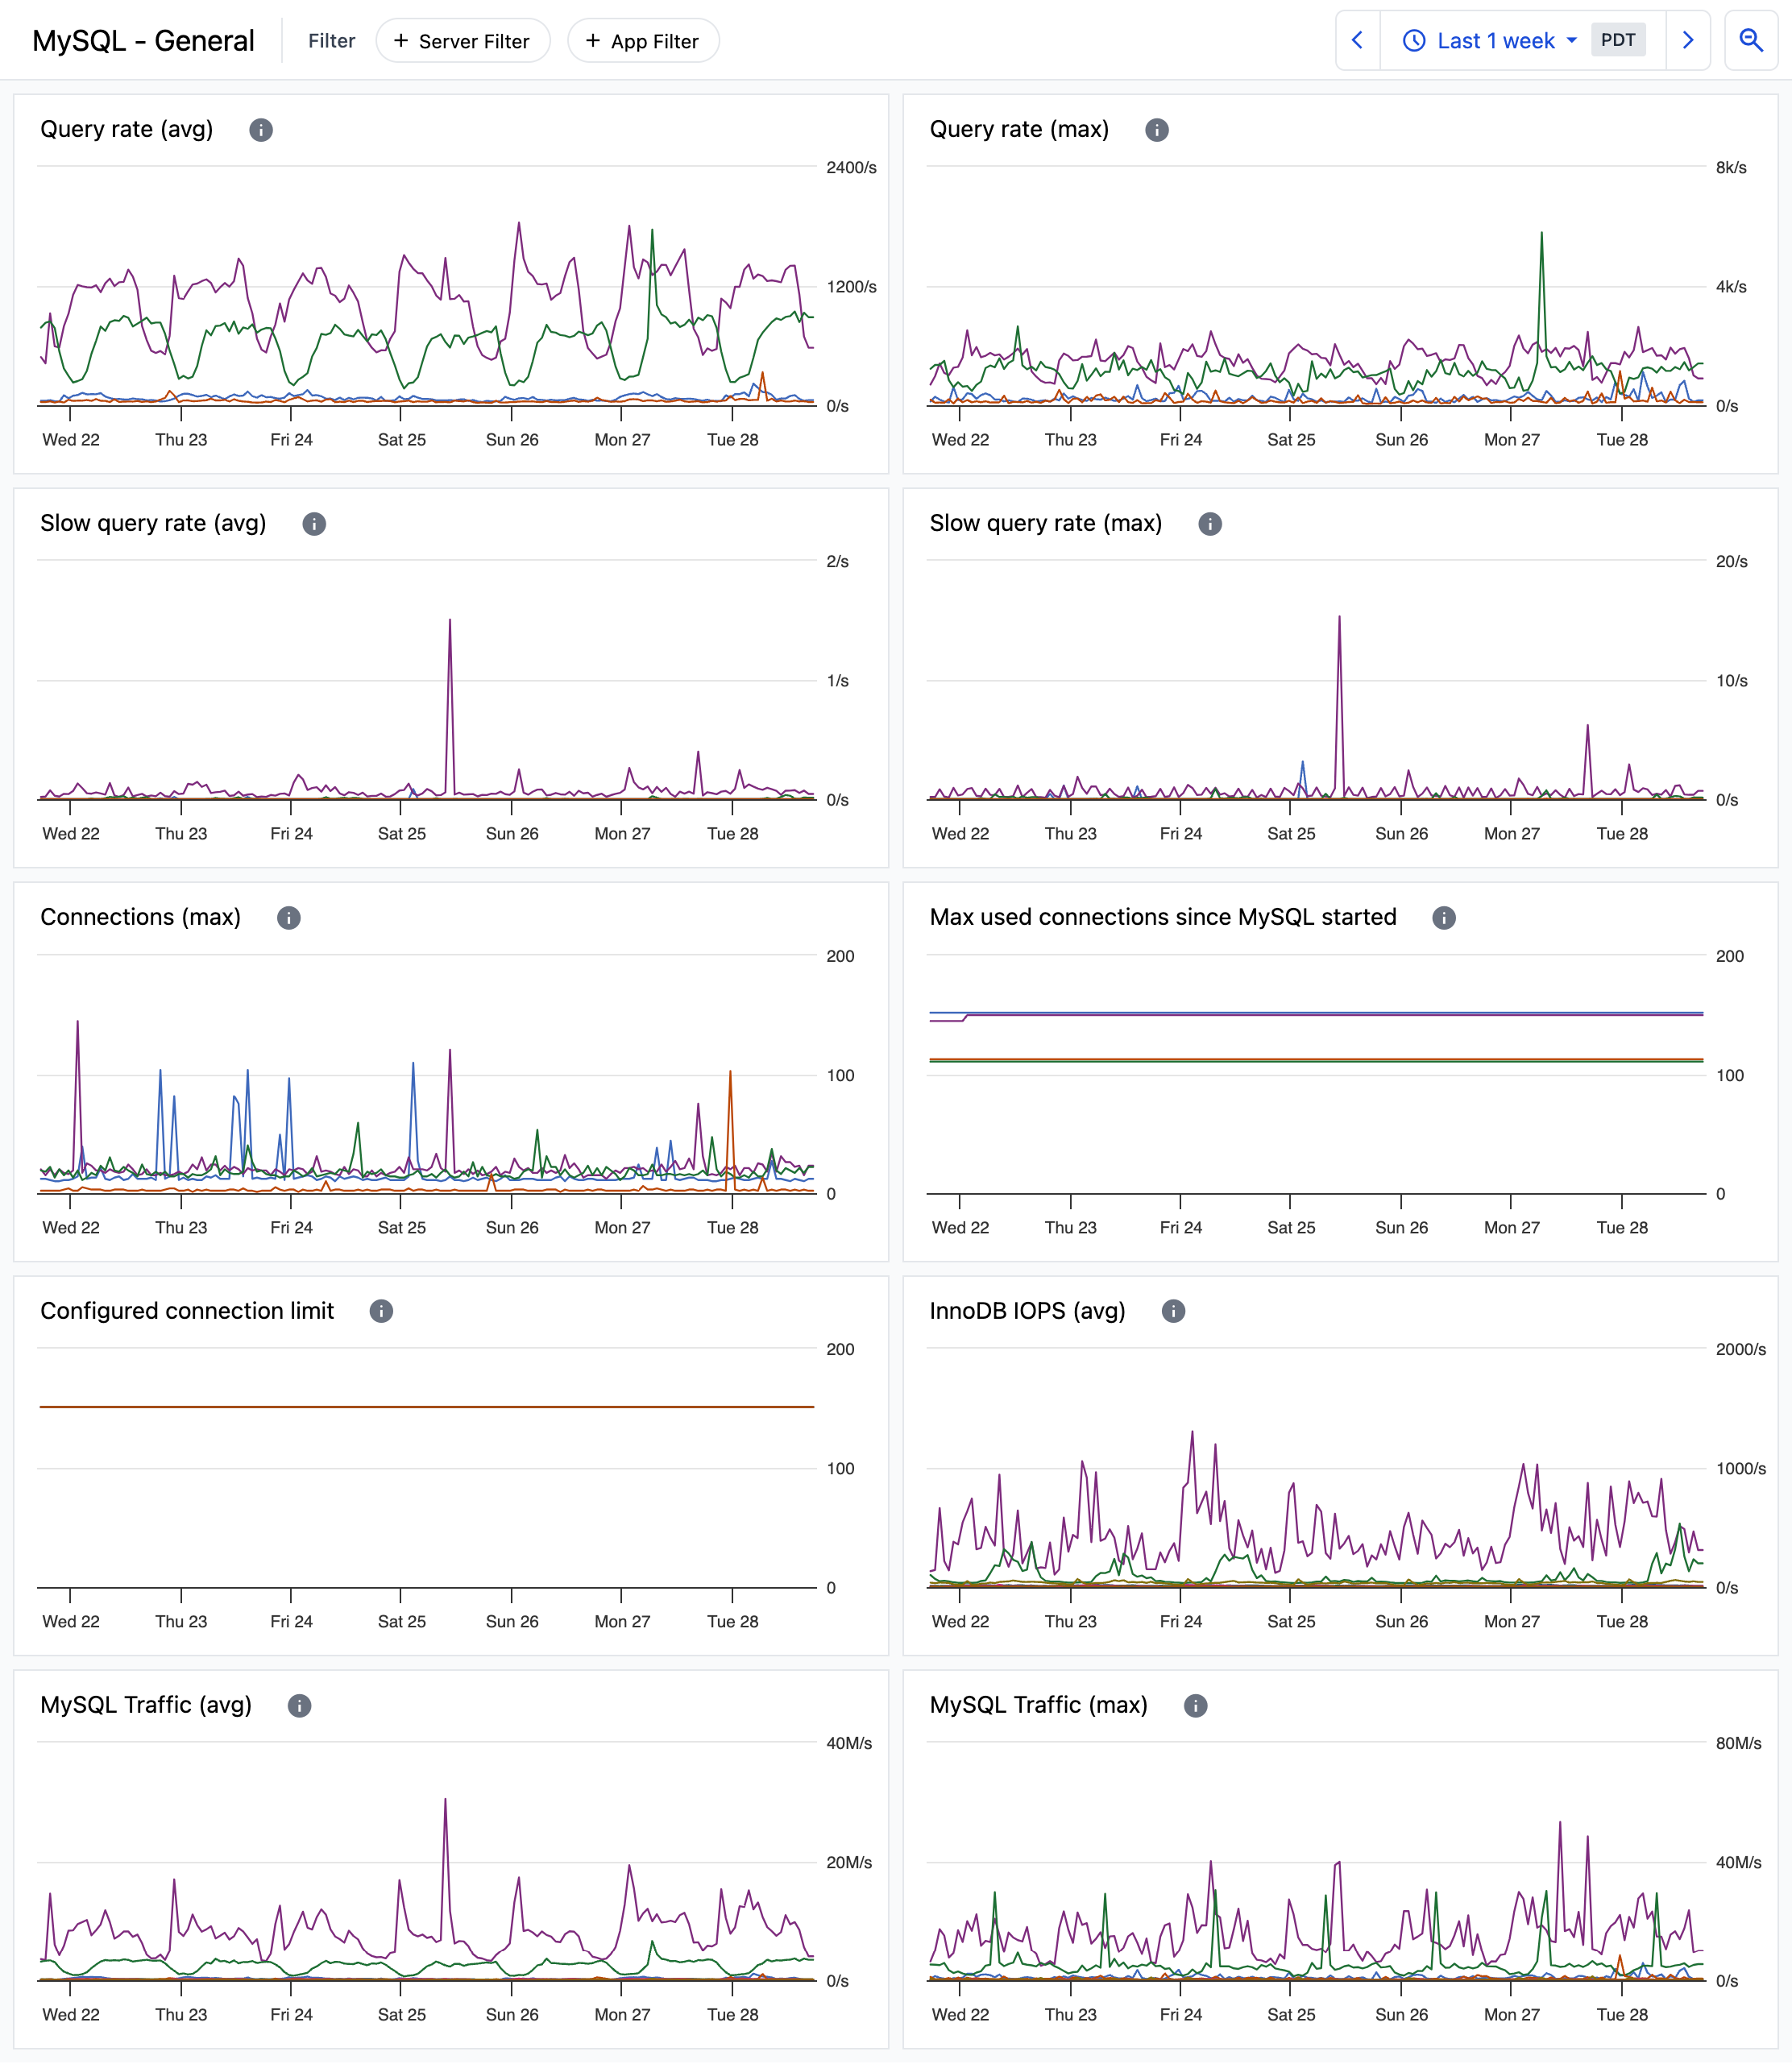
MySQL health overview
The MySQL - General dashboard provides information about MySQL activity and status.
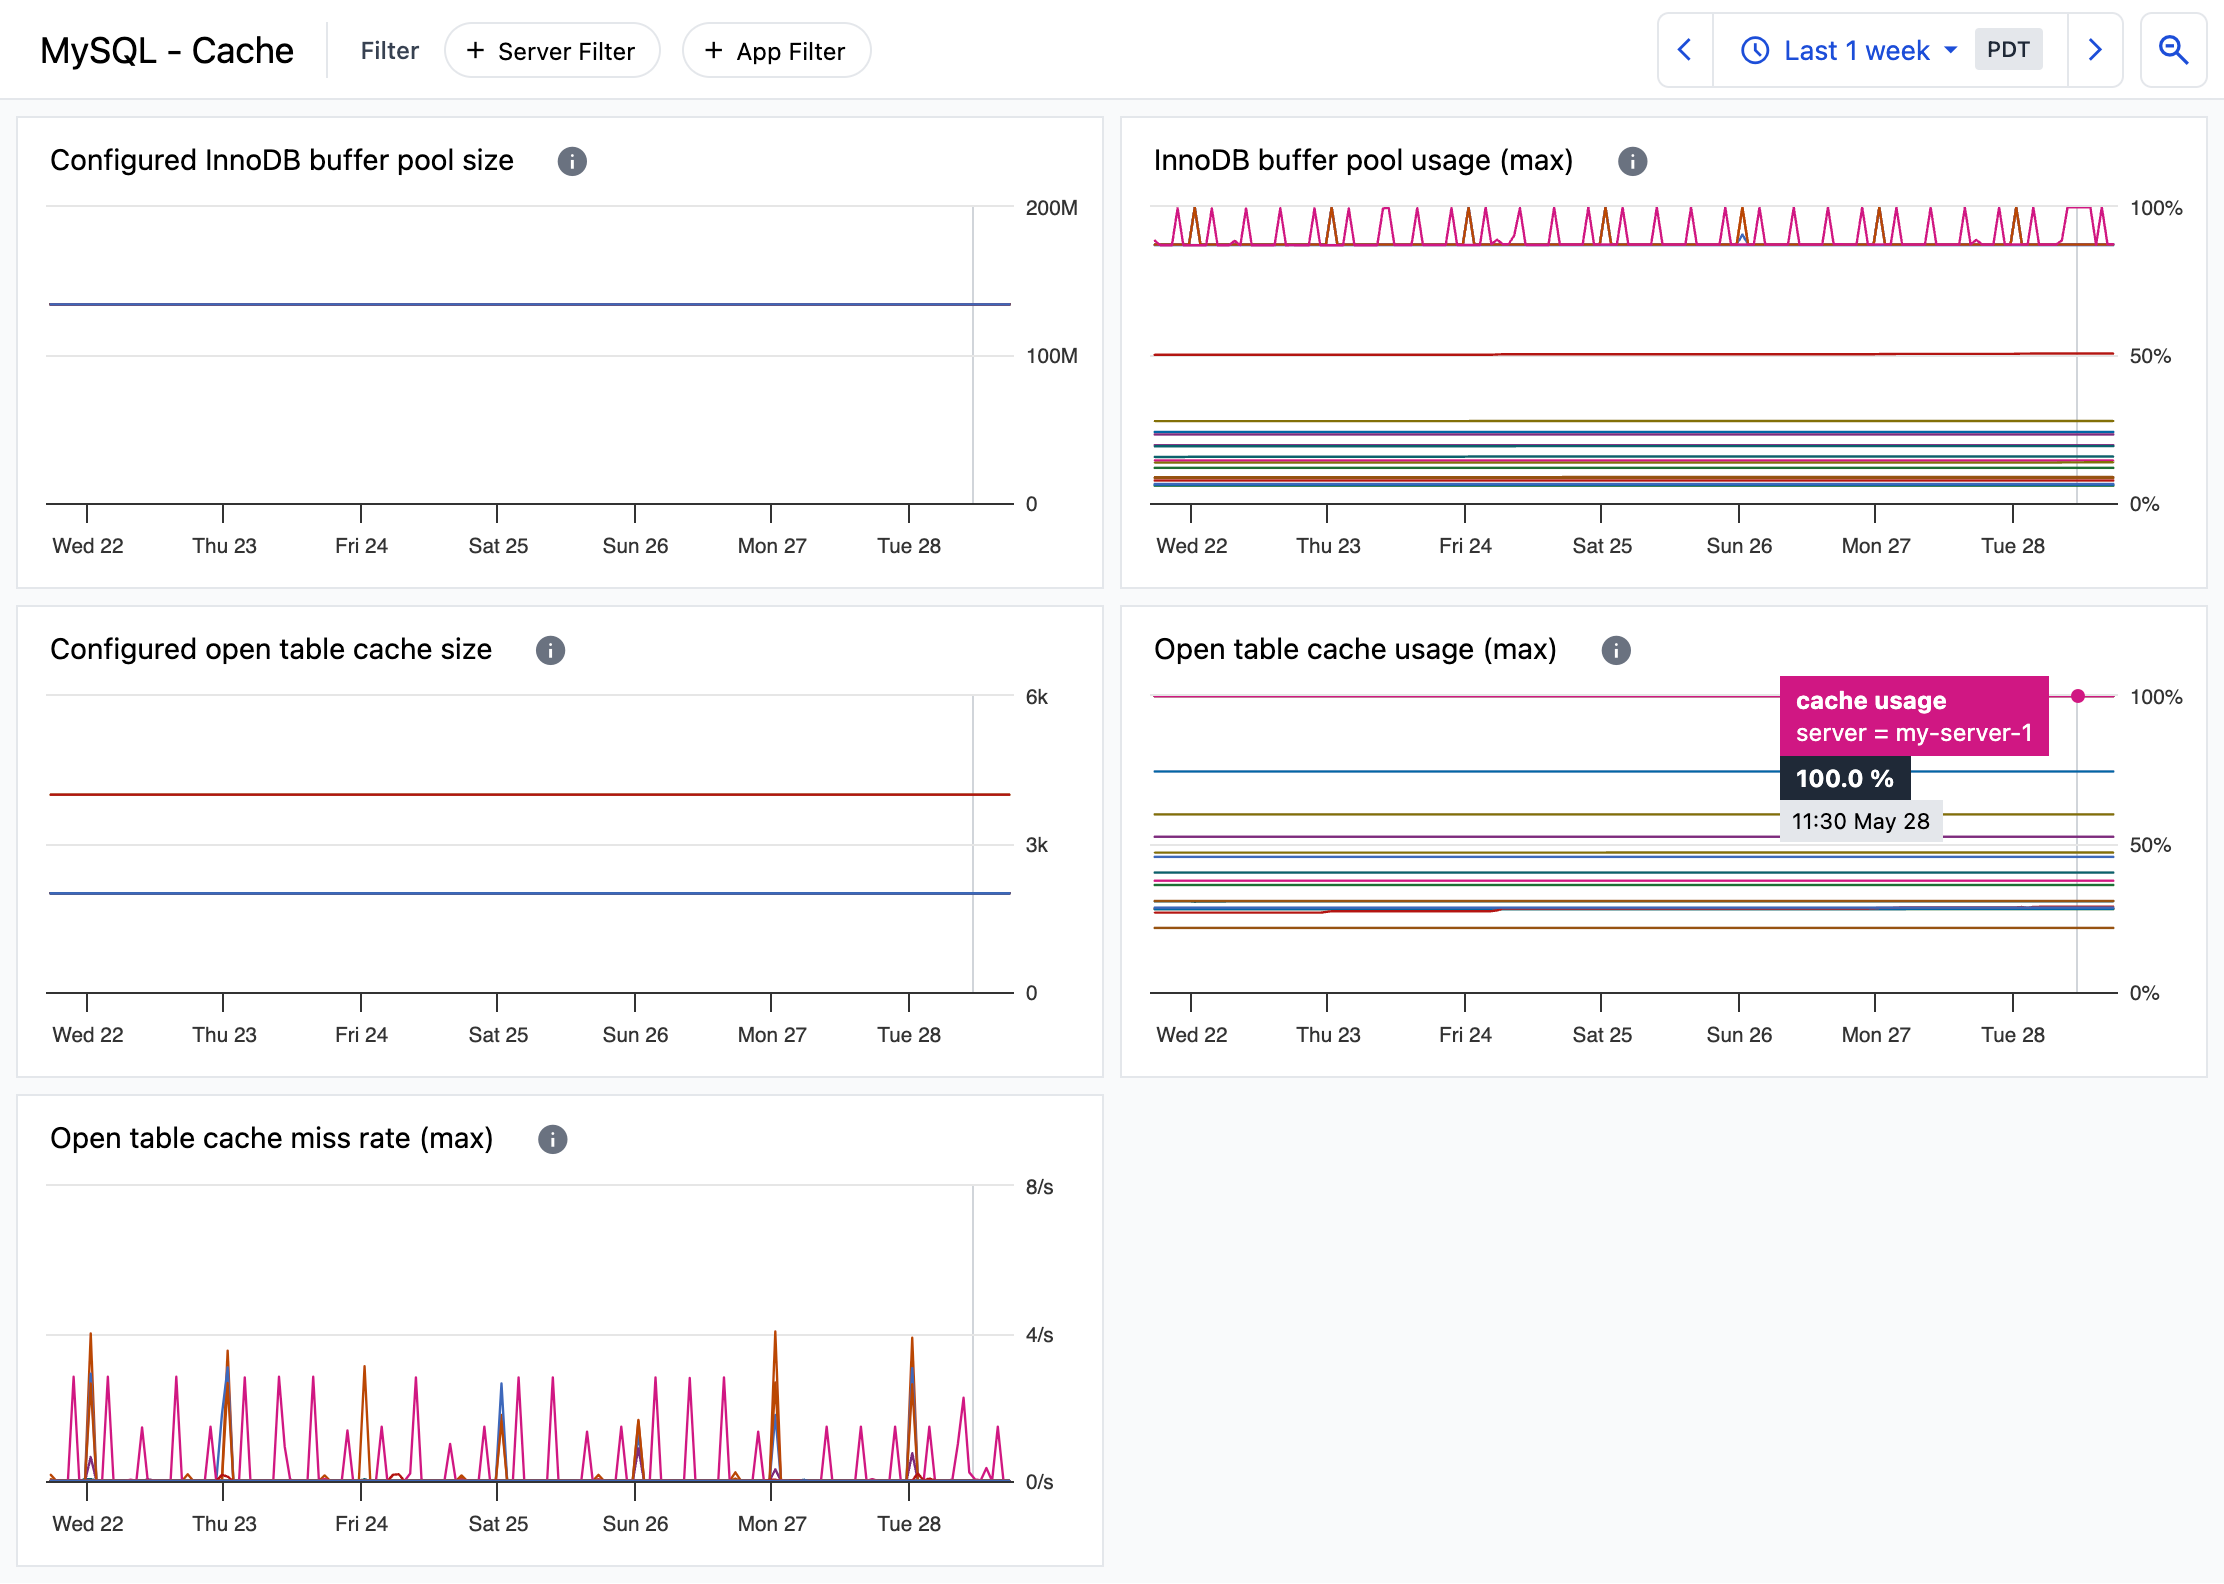
MySQL cache usage
The MySQL - Cache dashboard provides insight into MySQL cache usage.
Apply filters to dashboards
By default, dashboards display the most recent 24 hours of metrics for all of your servers and apps. Use filters to show metrics of a single server or app and to change the start and end times of the dashboard’s charts.
Your applied filter and time range will remain applied as you switch between monitoring dashboards.
Filter by server or app
To only show metrics from a single server or app, click +Server Filter or +App Filter at the top of the dashboard.
Filter by time range
While viewing a monitoring dashboard, you can select a time range using the time range options at the top of the dashboard The selected time range applies to all charts in a dashboard and remains applied as you switch between monitoring dashboards.
- Use a predefined time range. To select a predefined time range, click on the current time range and choose the desired time range from the menu.
- Shift forward and back. To shift the current time range forward or back, click the arrow icons to the right and left of the current time range.
- Zoom out. To zoom out, click the icon of the magnifying glass with a minus sign.
- Custom time range. To set a custom time range, click and drag across the desired time range of any chart in the dashboard. The selected time range will be applied to all charts.