
View current metrics in sortable lists
Resource lists
Resource lists can be accessed in ServerPilot by clicking the menu icon and selecting Monitoring.
Servers
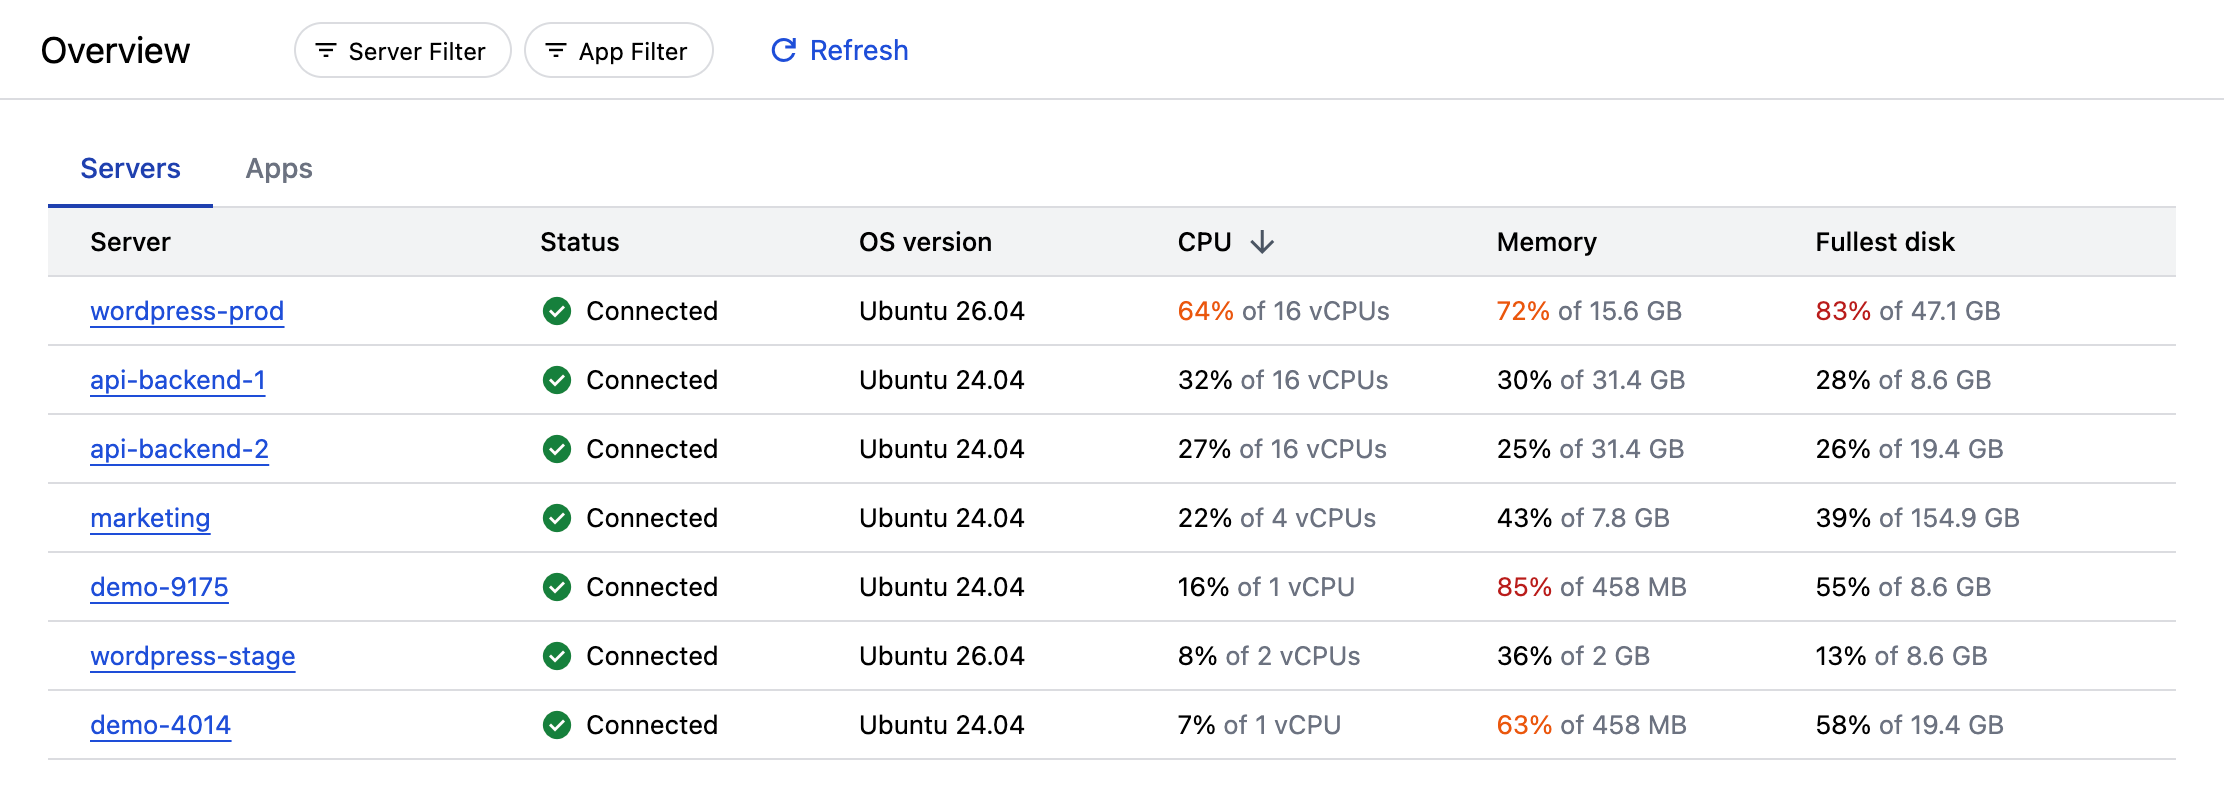
The Servers resource list shows the current values of the following for each server:
- Status of connection to ServerPilot
- OS version
- CPU usage (%)
- vCPUs (count)
- Memory usage (%)
- Memory size (bytes)
- Disk usage (%)
- Disk size (bytes)
For servers with more than one disk, the usage and size of the fullest disk (the disk with the highest usage) is shown.
Apps
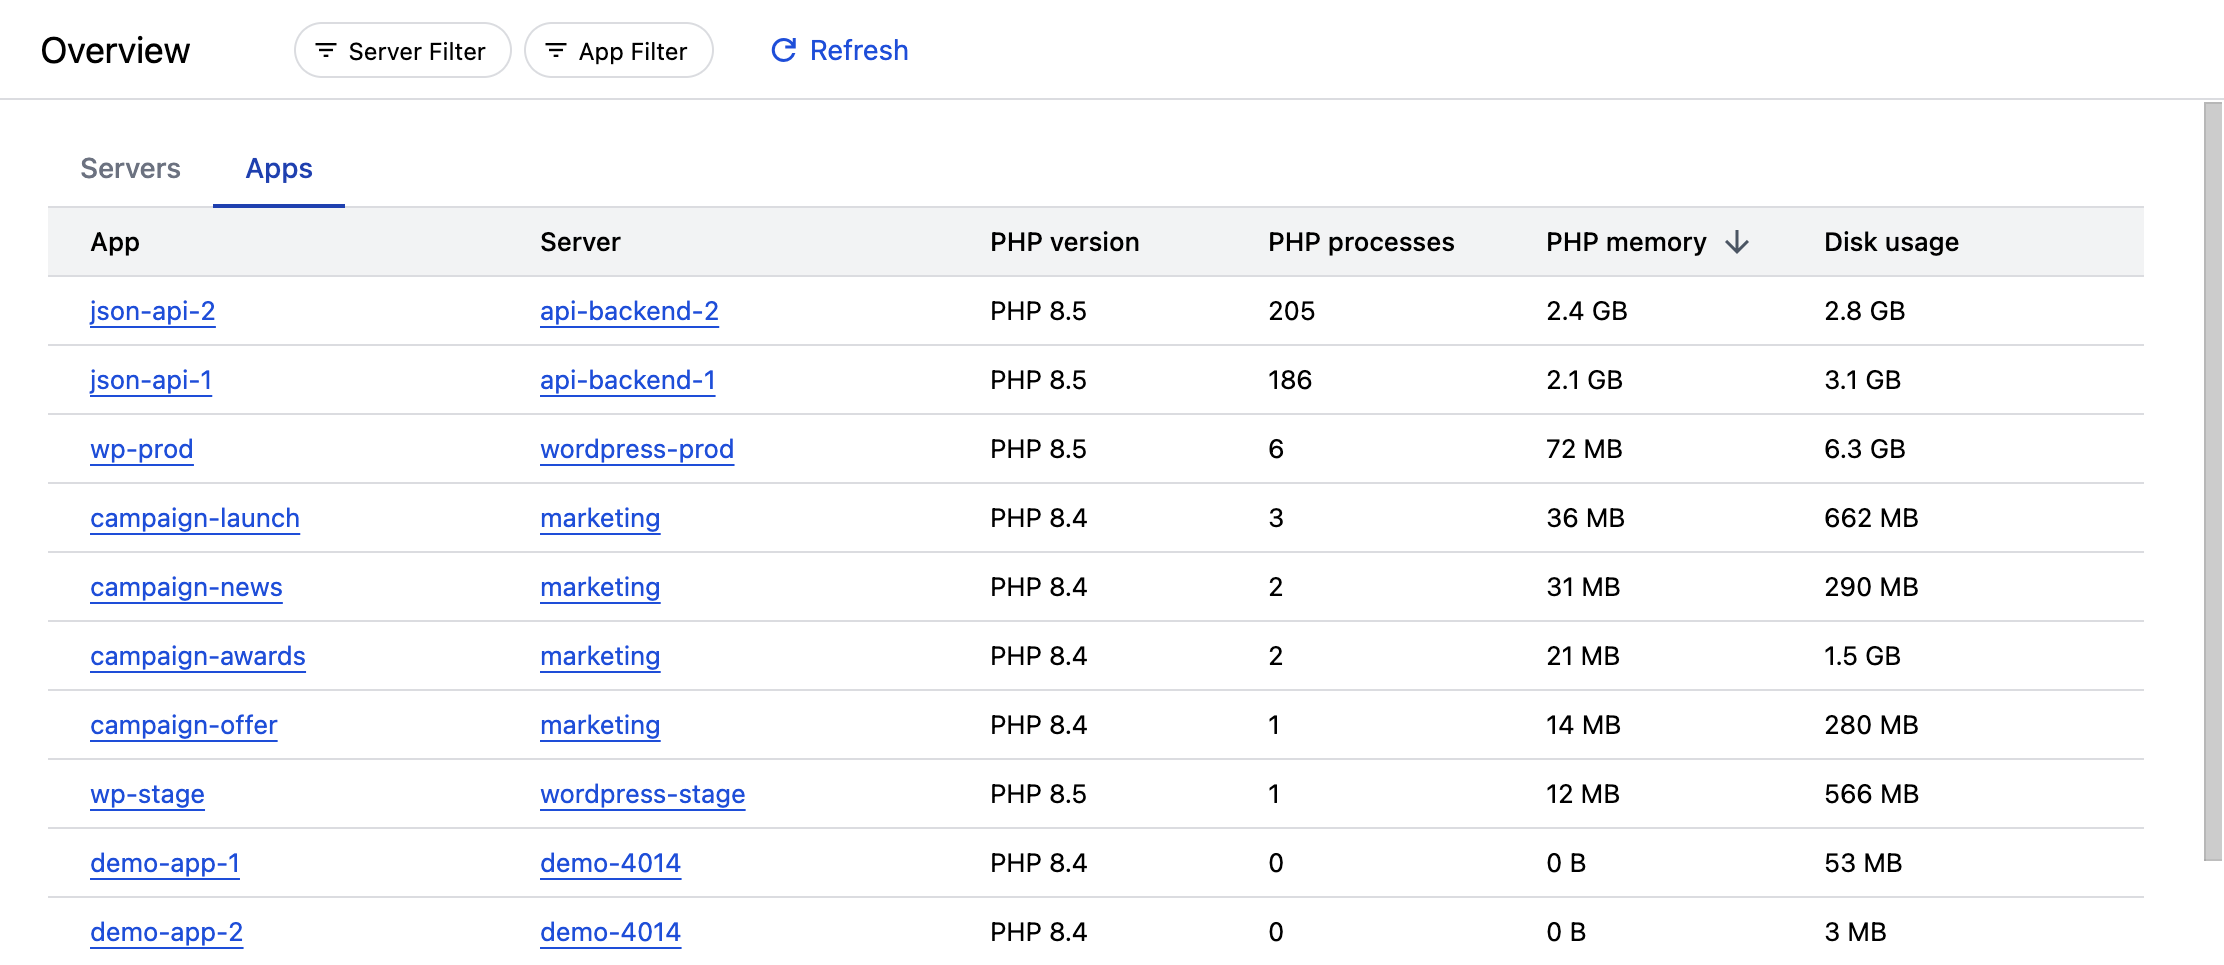
The Apps resource list shows the current values of the following for each app:
- PHP version
- PHP processes (count)
- PHP memory usage (bytes)
- Disk usage (bytes)
Sort resource lists
By default, resource lists are sorted by the name of the resource.
To sort by a different field, click the field name in the column header.
Apply filters to resource lists
Use filters to only show items related to a particular server or app.
Filter by server or app
To only show items related to a single server or app, click +Server Filter or +App Filter at the top of the resource list.